Yvonne Choquet-Bruhat obituary: mathematician who established that Einstein’s equations mirror the real world
Nature, Published online: 04 June 2025; doi:10.1038/d41586-025-01763-z
Pioneer of general relativity and gravitational-wave theories saw her work confirmed by observations 65 years later.Clustering pattern of dwarf galaxies not predicted by models of cosmic structure formation
Nature, Published online: 04 June 2025; doi:10.1038/d41586-025-01699-4
A surprising pattern of spatial distribution was discovered in dwarf galaxies, whereby diffuse ones cluster more strongly than do compact ones — opposite to the trend seen in massive galaxies. This finding challenges standard models of the formation of galactic structures, calling for theories about the assembly of visible- and dark-matter structures to be revised.Mon 16 Jun 16:00: Novel Approaches to Black Hole Ringdown Fits
Following a merger, a perturbed black hole relaxes into its final Kerr state, in part by radiating quasinormal modes (QNMs) — oscillations with specific complex frequencies and angular structures predicted by black hole perturbation theory. QNMs are widely used in waveform modelling and underpin key tests of general relativity and the nature of compact objects, though challenges remain, particularly in avoiding overfitting through well-motivated mode selection. In this talk, I will introduce new techniques for detecting and analysing QNMs, including spatial mapping, which extracts their angular structure, and a fast Bayesian fitting approach that models numerical relativity noise with Gaussian processes, providing a robust alternative to least-squares methods. I will present results obtained using the latest high-fidelity Cauchy-characteristic evolution (CCE) simulations by the SXS collaboration and show how these methods provide insight into the role of overtones and nonlinear effects, both of which will be important for future gravitational wave observations.
- Speaker: Richard Dyer (IoA)
- Monday 16 June 2025, 16:00-17:00
- Venue: Martin Ryle Seminar Room, KICC.
- Series: Astro Data Science Discussion Group; organiser: Dr Priscilla Canizares.
Euclid Quick Data Release (Q1): From images to multiwavelength catalogues: the Euclid MERge Processing Function
Euclid Quick Data Release (Q1): From images to multiwavelength catalogues: the Euclid MERge Processing Function
Dark Skies Council: International astronomical observatories join forces to protect Chile's skies
Faced with the growing risk that light pollution represents for the development of astronomy in Chile, the main international observatories with a presence in the country have formed a joint organization dedicated to protecting the dark skies of northern Chile. The council will act through Fundación Cielos de Chile and the Office for the Protection of the Quality of the Northern Chilean Sky (OPCC), with the objective of coordinating strategies and articulating actions in the face of the advance of light pollution.
Light pollution is increasing by 9.6% each year, according to a study published in Science magazine. Chile's skies are also being affected by this phenomenon and it is estimated that a 10% increase in sky brightness would mean a loss of 12.07% of the original capacity of the optical telescopes located in the country.
In response to this problem, the Association of Universities for Research in Astronomy (AURA), the Giant Magellan Telescope (GMT), the European Southern Observatory (ESO) and the Las Campanas Observatory of the Carnegie Institution for Science, signed an agreement to create the Dark Skies Council. Through this alliance, the institutions will work in a coordinated manner to protect Chile's privileged skies.
The signatory institutions manage some of the largest and most advanced optical observatories in the world, all of them located in Chile: AURA is in charge of the Cerro Tololo Observatory, Gemini South and the under-construction Vera C. Rubin Observatory; the Giant Magellan Telescope (GMT), also under construction, will be installed at Las Campanas, where the Carnegie Science Institution currently operates its observatory; while ESO operates observatories at Paranal and La Silla, and will soon operate the Extremely Large Telescope (ELT) under construction at Cerro Armazones.
The importance of caring for dark skiesThanks to the exceptional quality of its skies, Chile today concentrates nearly 40% of the world's astronomical observation capacity. In the last two decades, the number of astronomical institutions has doubled in the country, and the number of people dedicated to this science has tripled. In addition, three mega-telescopes will be installed in the coming years, which will be among the largest in the world, with a total investment of more than 5 billion dollars. Their operation will allow Chile to exceed 60% of the global astronomical observation capacity by 2030.
However, this leadership is at risk. The sustained increase of light pollution sources from urban centers, industrial and mining operations, ports and highways threatens the natural darkness of the night sky in the regions of Antofagasta, Atacama and Coquimbo, key areas for astronomy. "The quality and darkness of the night sky are fundamental to the scientific operations of our observatories. The preservation of the dark skies of northern Chile is a priority for the signatory institutions, since the continuity of their present and future activities depends on it," states the signed agreement.
What is the Dark Skies Council and who are its members?The Dark Skies Council is composed of six representatives of the observatories and its main mission will be to define and monitor the implementation of a common strategy to protect dark skies. Its functions include coordinating activities with the Office for the Protection of Sky Quality in Northern Chile (OPCC) and Fundación Cielos de Chile, as well as the management and allocation of resources to implement concrete initiatives in the territory.
The OPCC works for the protection of dark skies, essential for astronomy, and provides technical support to facilitate the implementation of light pollution regulations in the regions of Antofagasta, Atacama and Coquimbo. For 25 years it has collaborated with municipalities, local communities and regional actors to promote actions for the prevention and reduction of this type of pollution.
For its part, the work of Fundación Cielos de Chile has focused on the conservation of the night skies as the country's natural, scientific and cultural heritage, and promotes the responsible use of artificial light for the benefit of science, biodiversity, human health and sustainable tourism.
The Council appointed Oscar Contreras, who is GMT's Vice President and Representative in Chile, as its first Director. Contreras has extensive experience at the intersection of science, public policy and conservation.
Thus, as Chile strengthens its leadership in dark skies protection, the launch of the Dark Skies Council marks a new era characterized by proactive stewardship to preserve one of Earth's most important windows to the cosmos.
More Information About AURAThe Association of Universities for Research in Astronomy (AURA) is a non-profit organization founded in 1957 in the United States and is composed of 49 U.S. institutions and 3 international affiliates, including the University of Chile and the Pontificia Universidad Católica de Chile.
AURA is a scientific institution that builds, maintains and operates world-class ground-based optical telescope facilities for the U.S. National Science Foundation (NSF) through the NSF NOIRLab center and the National Solar Observatory (NSO). For NASA, AURA manages the Space Telescope Science Institute (STScI).
NSF NOIRLab is the leading U.S. national center for ground-based astronomy in the optical and infrared range. In Chile it manages the Cerro Tololo Inter-American Observatory (CTIO), Gemini South of the Gemini International Observatory, and the Vera C. Rubin Observatory (currently under construction). Rubin Observatory (currently under construction). NSF NOIRLab enables the diverse and inclusive astronomical community to advance humanity's understanding of the Universe by developing and operating state-of-the-art ground-based observatories and providing data products and services to the entire community.
About ESOThe European Southern Observatory (ESO) provides the global scientific community with the means to unlock the secrets of the Universe for the benefit of all. We design, build and operate state-of-the-art ground-based observatories - used by the astronomical community to address exciting questions and spread the fascination of astronomy - and promote international collaboration in astronomy. Established as an intergovernmental organization in 1962, today ESO is supported by 16 Member States (Austria, Belgium, Czech Republic, Denmark, Finland, France, Germany, Ireland, Italy, Netherlands, Poland, Portugal, Spain, Sweden, Switzerland, United Kingdom and United States), with Chile as host country and Australia as a strategic partner. ESO's headquarters and its planetarium and visitor center, the ESO Supernova, are located near Munich (Germany), while the Chilean Atacama Desert, a wonderful place with unique conditions for observing the sky, hosts our telescopes. ESO operates three observing sites: La Silla, Paranal and Chajnantor. At Paranal, ESO operates the Very Large Telescope together with its interferometer VLTI (Very Large Telescope Interferometer), and survey telescopes such as VISTA. Also at Paranal, ESO will host and operate the Cherenkov Telescope Array South, the world's largest and most sensitive gamma-ray observatory. At Chajnantor, together with international partners, ESO operates ALMA, a facility that observes the skies in the millimeter and submillimeter range. On Cerro Armazones, near Paranal, we are building "the world's biggest eye on the sky": the ESO Extremely Large Telescope (ELT). From our offices in Santiago (Chile), we support the development of our operations in the country and are committed to Chilean partners and Chilean society.
About the Giant Magellan TelescopeThe Giant Magellan Telescope is the future of space exploration from Earth. It will have seven of the world's largest mirrors, which will form a 25.4-meter telescope to produce images of the Universe with an unprecedented level of detail. It will shed new light on the cosmic mysteries of dark matter, investigate the origins of chemical elements and confirm, for the first time, the existence of signs of life on distant planets. The Giant Magellan Telescope is a project of the GMTO Corporation, an international consortium of 14 universities and research institutions representing the United States, Australia, Brazil, Chile, Israel, South Korea and Taiwan. The telescope is being built in the United States and will be assembled in Chile in the early 2030s. Learn more about The Universe Awaits at giantmagellan.org.
About Las Campanas ObservatoryCarnegie Science's Las Campanas Observatory in Chile provides the scientific community with access to world-class telescopes with views of the Magellanic clouds and the entire southern sky. Carnegie Science is headquartered on Broad Branch Road in Washington, D.C., with three research divisions on both coasts of the United States and Las Campanas Observatory in Chile. It is a nonprofit, independent, endowed organization under the direction of President John Mulchaey. Carnegie Science empowers its researchers to answer the most important questions of our time, making discoveries that transform our understanding of life, the planets and the universe at large. The research breakthroughs made have radically changed the way we understand science.
NASA’s Webb Rounds Out Picture of Sombrero Galaxy’s Disk
- Webb
- News
- Overview
- Science
- Observatory
- Multimedia
- Team
- More
NASA, ESA, CSA, STScI
After capturing an image of the iconic Sombrero galaxy at mid-infrared wavelengths in late 2024, NASA’s James Webb Space Telescope has now followed up with an observation in the near-infrared. In the newest image, the Sombrero galaxy’s huge bulge, the tightly packed group of stars at the galaxy’s center, is illuminated, while the dust in the outer edges of the disk blocks some stellar light.
Image A: Sombrero Galaxy (NIRCam) NASA’s James Webb Space Telescope’s new image of the famous Sombrero galaxy in near-infrared wavelengths shows dust from the outer ring blocking stellar light from the inner portions of the galaxy. NASA, ESA, CSA, STScI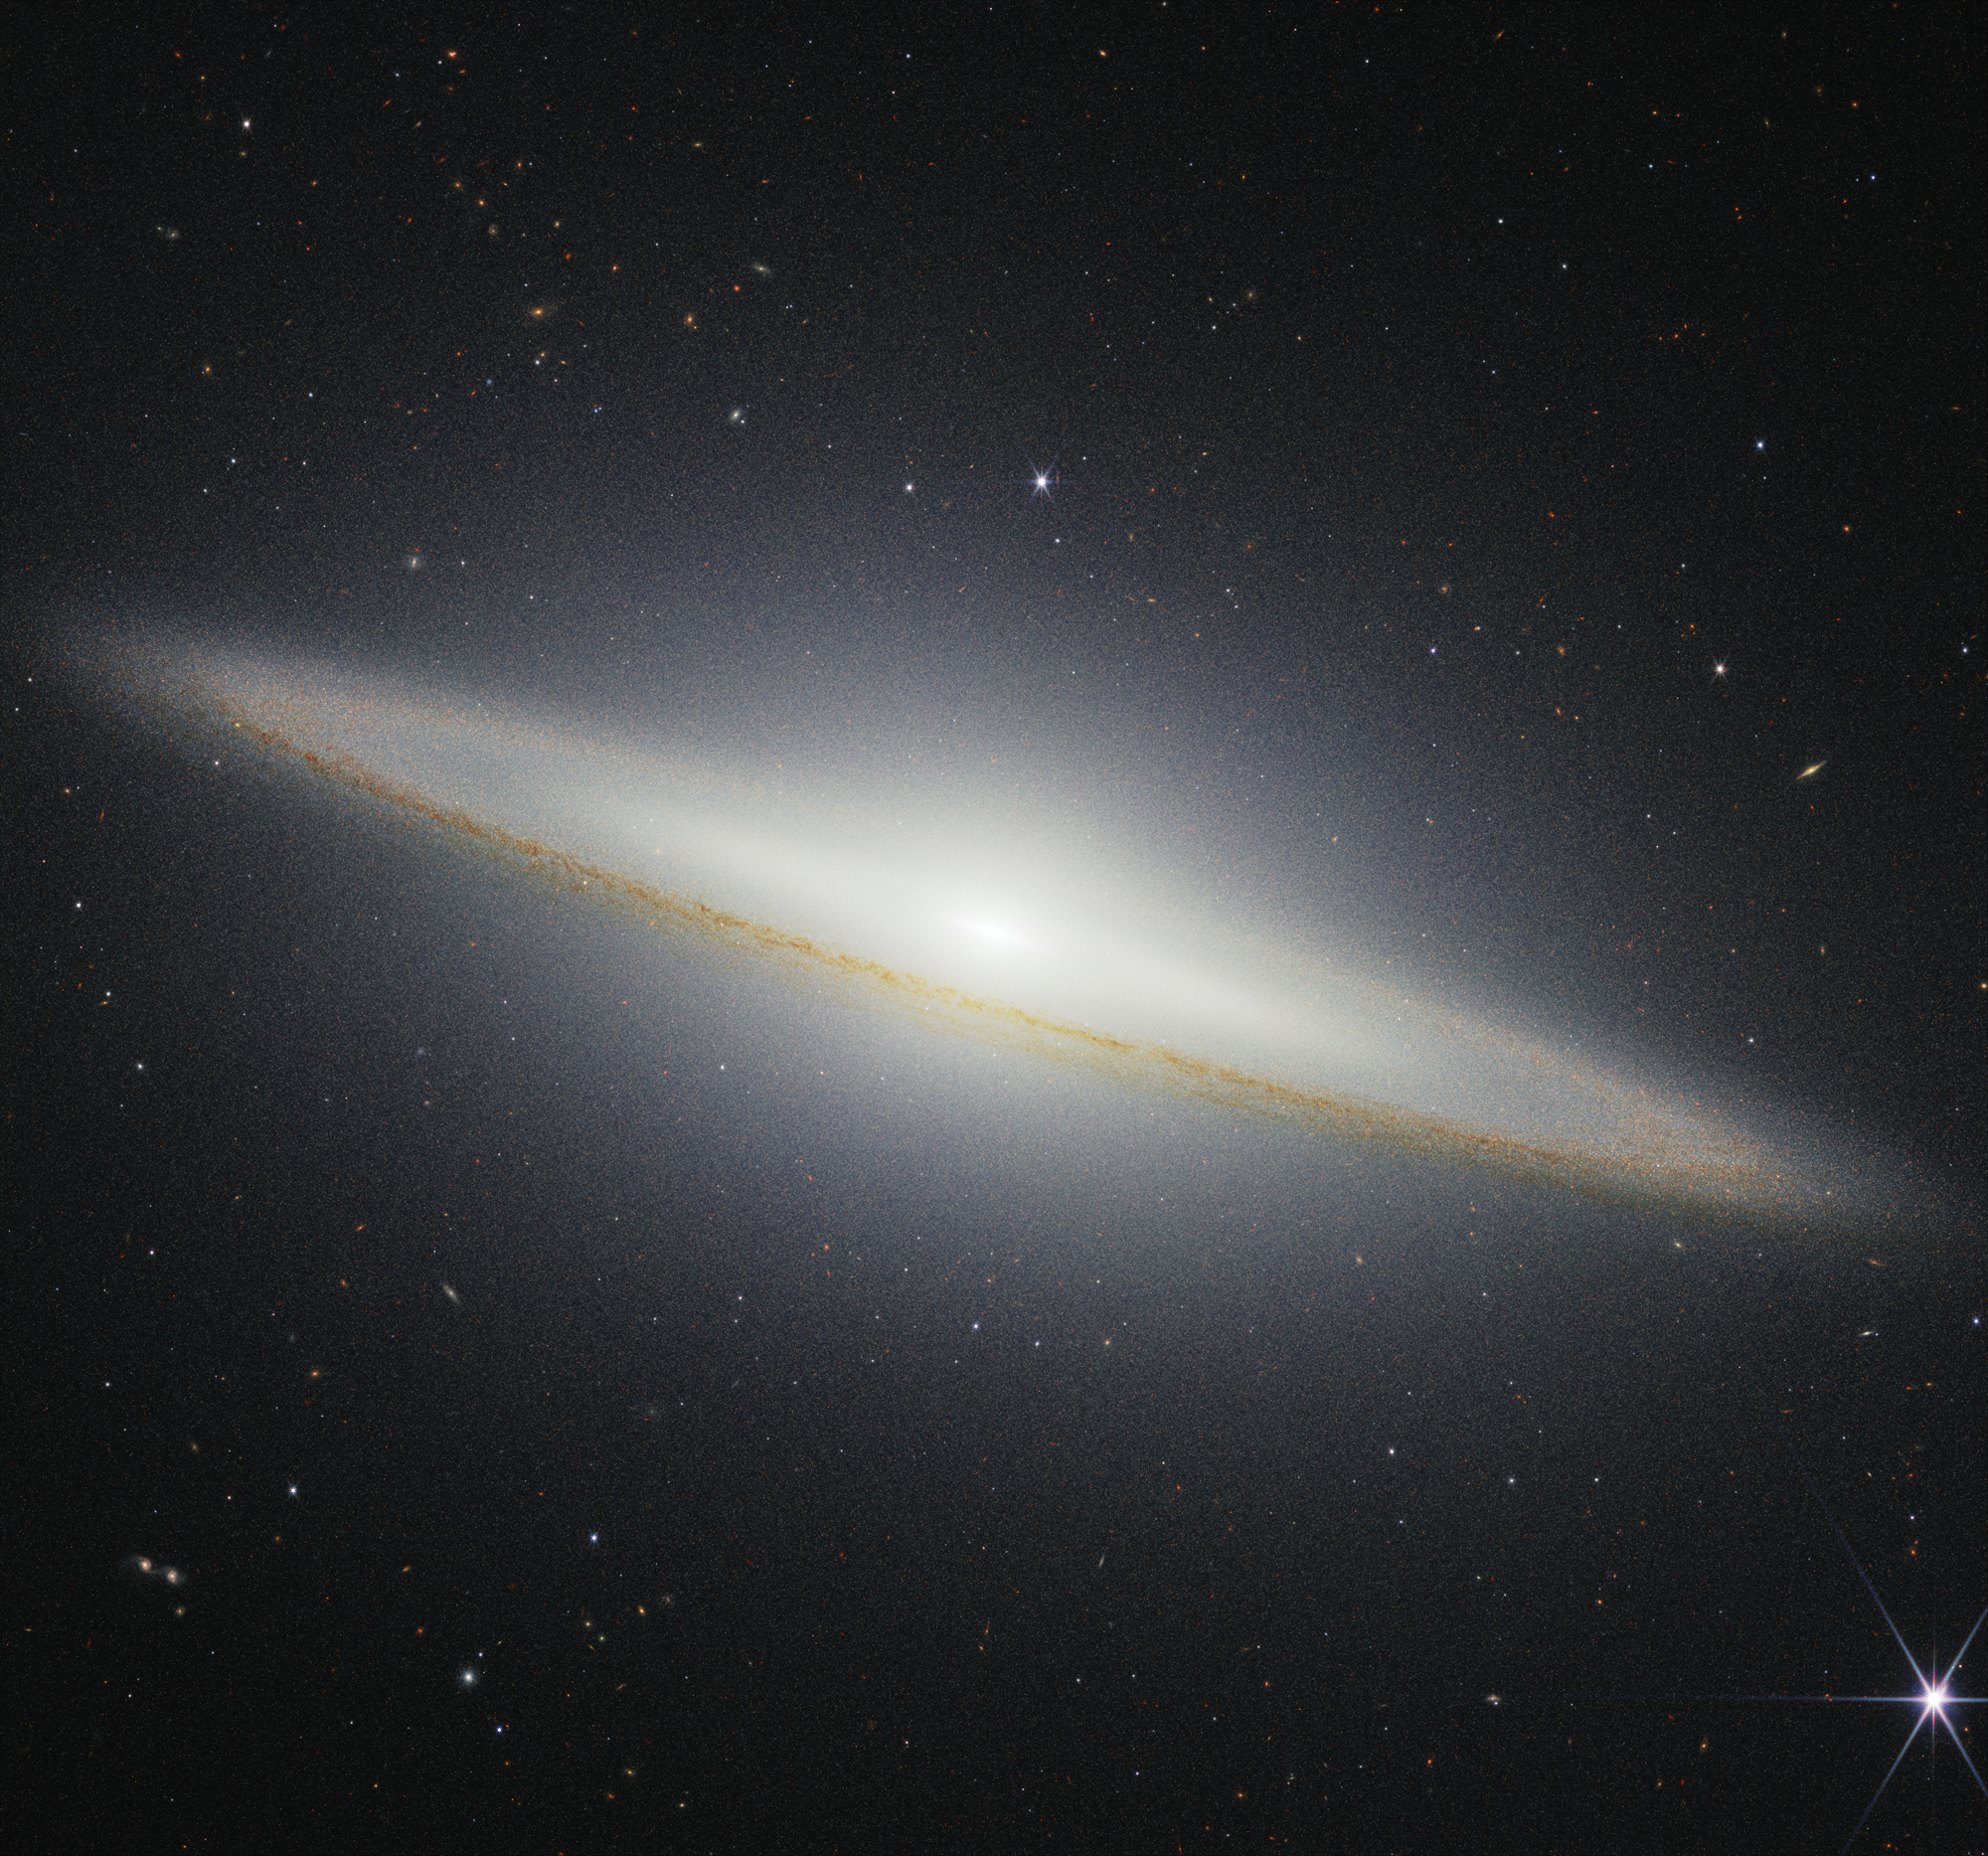
Studying galaxies like the Sombrero at different wavelengths, including the near-infrared and mid-infrared with Webb, as well as the visible with NASA’s Hubble Space Telescope, helps astronomers understand how this complex system of stars, dust, and gas formed and evolved, along with the interplay of that material.
When compared to Hubble’s visible light image, the dust disk doesn’t look as pronounced in the new near-infrared image from Webb’s NIRCam (Near-Infrared Camera) instrument. That’s because the longer, redder wavelengths of infrared light emitted by stars slip past dust more easily, so less of that stellar light is blocked. In the mid-infrared image, we actually see that dust glow.
Image B: Sombrero Galaxy (NIRCam/MIRI) The Sombrero galaxy is split diagonally in this image: near-infrared observations from NASA’s James Webb Space Telescope are at the left, and mid-infrared observations from Webb are at the right. NASA, ESA, CSA, STScI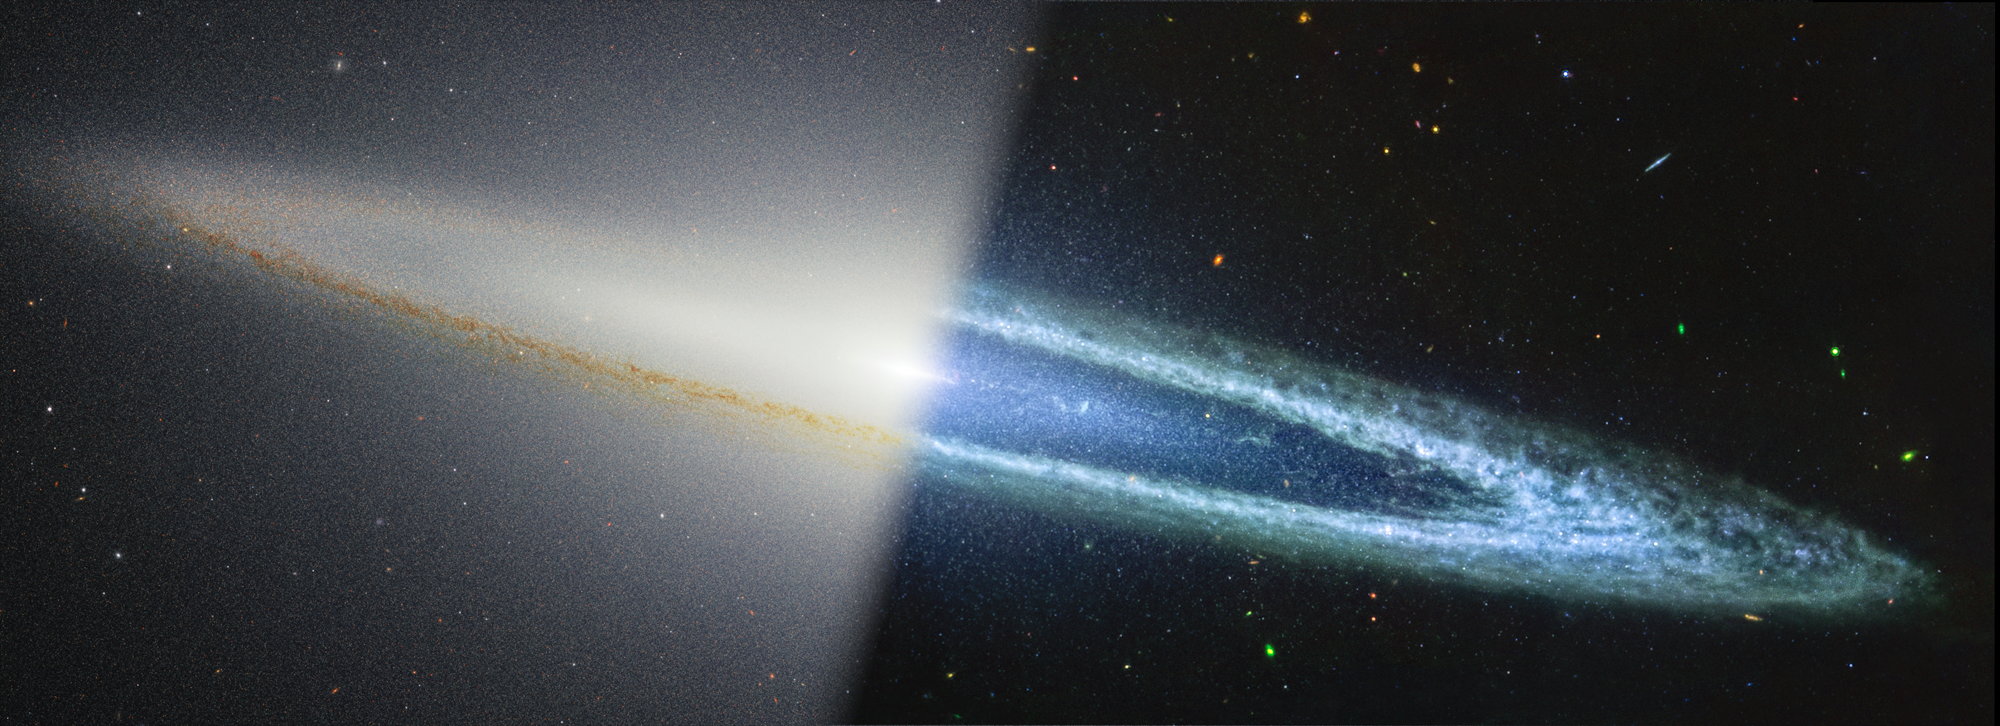
The Sombrero galaxy is located about 30 million light-years away from Earth at the edge of the Virgo galaxy cluster, and has a mass equal to about 800 billion Suns. This galaxy sits “edge on” to us, meaning we see it from its side.
Studies have indicated that hiding behind the galaxy’s smooth dust lane and calming glow is a turbulent past. A few oddities discovered over the years have hinted this galaxy was once part of a violent merger with at least one other galaxy.
The Sombrero is home to roughly 2,000 globular clusters, or collections of hundreds of thousands of old stars held together by gravity. Spectroscopic studies have shown the stars within these globular clusters are unexpectedly different from one another.
Stars that form around the same time from the same material should have similar chemical ‘fingerprints’ – for example, the same amounts of elements like oxygen or neon. However, this galaxy’s globular clusters show noticeable variation. A merger of different galaxies over billions of years would explain this difference.
Another piece of evidence supporting this merger theory is the warped appearance of the galaxy’s inner disk.
While our view is classified as “edge on,” we’re actually seeing this nearly edge on. Our view six degrees off the galaxy’s equator means we don’t see it directly from the side, but a little bit from above. From this view, the inner disk appears tilted inward, like the beginning of a funnel, instead of flat.
Video A: Sombrero Galaxy Fade (Visible, Near-Infrared, Mid-Infrared) This video compares images of the Sombrero galaxy, also known as Messier 104 (M104). The first image shows visible light observed by the Hubble Space Telescope’s Advanced Camera for Surveys. The second is in near-infrared light and shows NASA’s Webb Space Telescope’s look at the galaxy using NIRCam (Near-Infrared Instrument). The final image shows mid-infrared light observed by Webb’s MIRI (Mid-Infrared Instrument).Credit: NASA, ESA, CSA, STScI
The powerful resolution of Webb’s NIRCam also allows us to resolve individual stars outside of, but not necessarily at the same distance as, the galaxy, some of which appear red. These are called red giants, which are cooler stars, but their large surface area causes them to glow brightly in this image. These red giants also are detected in the mid-infrared, while the smaller, bluer stars in the near-infrared “disappear” in the longer wavelengths.
Also in the NIRCam image, galaxies of diverse shapes and colors are scattered throughout the backdrop of space. The variety of their colors provides astronomers with clues about their characteristics, such as their distance from Earth.
The James Webb Space Telescope is the world’s premier space science observatory. Webb is solving mysteries in our solar system, looking beyond to distant worlds around other stars, and probing the mysterious structures and origins of our universe and our place in it. Webb is an international program led by NASA with its partners, ESA (European Space Agency) and CSA (Canadian Space Agency).
To learn more about Webb, visit:
DownloadsClick any image to open a larger version.
View/Download all image products at all resolutions for this article from the Space Telescope Science Institute.
Media ContactsLaura Betz – laura.e.betz@nasa.gov
NASA’s Goddard Space Flight Center, Greenbelt, Md.
Hannah Braun – hbraun@stsci.edu
Space Telescope Science Institute, Baltimore, Md.
Christine Pulliam – cpulliam@stsci.edu
Space Telescope Science Institute, Baltimore, Md.
Article: Types of Galaxies
Video: Different types of galaxies
Article: Sombrero Galaxy’s Halo Suggests Turbulent Past
More Images: Images of the Sombrero Galaxy in different types of light
Video: Sonification of Sombrero Galaxy images
Related For Kids En Español Keep Exploring Related Topics James Webb Space TelescopeShare Details Last Updated Jun 03, 2025 Editor Marty McCoy Contact Laura Betz laura.e.betz@nasa.gov Related Terms
Private ispace Resilience probe will attempt lunar landing this week
Why it's taking a century to pin down the speed of the universe
Tue 10 Jun 13:00: The Response and Observability of Exo-Earth Climates to Cometary Impacts
Impacts by icy bodies likely played a key role in shaping the composition, and habitability, of Solar-System planets. We determine the role they may play in exoplanetary systems by coupling a cometary impact model with a 3D, Earth-analogue, climate model. I will discuss how both the impact-delivered water and thermal energy affects the global climate and composition, including: i) a modified cloud greenhouse effect and planetary albedo, ii) an enhancement in the abundance of most oxygen-bearing molecules (bar ozone), and iii) an enhancement in the escape rate of hydrogen from the exosphere. I will describe how these responses are shaped by atmospheric circulations driven by the planetary orbital configuration, including the role that impact location plays in setting the vertical transport and hence hydrogen escape rate. Finally, I will quantify the potential observability of individual massive impacts in future observations of exo-Earths.
- Speaker: Felix Sainsbury-Martinez (Leeds)
- Tuesday 10 June 2025, 13:00-14:00
- Venue: Ryle seminar room + ONLINE - Details to be sent by email.
- Series: Exoplanet Seminars; organiser: Dr Dolev Bashi.
Tue 10 Jun 11:15: Intuitive knowledge systems for discovery
Join us for an exploration of how intuitive knowledge systems might complement current approaches in scientific discovery. Drawing from conversations during her fellowship at the Cavendish, artist Akeelah Bertram examines the acknowledged limits of current calculation systems and the role of intuition for receiving unknown phenomena. Through readings from her developing publication “Sacred Architecture,” she reflects on parallel knowledge systems, drawing from Caribbean congregational practices and embodied ways of knowing. This talk explores questions about the convergence of rigorous scientific inquiry with intuitive methodologies, considering what might emerge when different ways of knowing are held in dialogue.
- Speaker: Akeelah Bertram (Cavendish Arts Science Fellow)
- Tuesday 10 June 2025, 11:15-12:00
- Venue: Coffee area, Battcock Centre.
- Series: Hills Coffee Talks; organiser: Charles Walker.
Tue 10 Jun 16:00: From Squiggles to Signals: Using AI for Discovery in Time-Domain Astronomy
New large-scale astronomical surveys are observing orders of magnitude more sources than previous surveys, making standard approaches of visually identifying new and interesting phenomena unfeasible. Upcoming surveys such as the Vera Rubin Observatory’s Legacy Survey of Space and Time (LSST) and ongoing surveys such as the Transiting Exoplanet Survey Satellite (TESS) have the potential to revolutionize time-domain astronomy, providing opportunities to discover entirely new classes of events while also enabling a deeper understanding of known phenomena. The opportunity for serendipitous discovery in this domain is a new challenge that can be made systematic with data-driven methods, which are particularly suitable for identifying rare and unusual events in large datasets. In this talk, I’ll explore the potential for anomaly detection and representation learning in big datasets, and describe the challenge of applying these methods to real-time surveys. I’ll present novel machine learning methods for automatically detecting anomalous transient events such as kilonovae and peculiar supernovae, and characterising variable stars. I’ll explore the challenge of developing representative latent spaces useful for downstream machine learning tasks and present a novel causally-motivated foundation model. I’ll apply the approach to transients from the Zwicky Transient Facility (ZTF) and simulations of variable stars while discussing applications to upcoming surveys.
- Speaker: Daniel Muthukrishna (MIT)
- Tuesday 10 June 2025, 16:00-17:00
- Venue: Martin Ryle Seminar Room, KICC.
- Series: Astro Data Science Discussion Group; organiser: km723.
Thu 12 Jun 16:00: Transient astrophysics with the Gravitational wave Optical Transient Observer (GOTO)
Gravitational-wave (GW) multi-messenger astronomy holds immense promise for our understanding of the Universe, impacting studies of cosmology, the production of elements, and the final fates of stars. To date, however, only a single credible source, GW170817 , caused by the merger of two neutron stars, has been detected both in GWs and electromagnetically. I will discuss the scientific potential and challenges of observing more multi-messenger events, as motivation for the GOTO project: a UK-led transient sky survey composed of a fleet of rapidly-responding telescope arrays. The primary science driver of GOTO is scanning the sky in response to GW alerts, to search for their electromagnetic counterparts. Alongside overviewing GOTO ’s capabilities and recent multi-messenger efforts, I will present highlights from various ancillary science enabled by the array. This includes rapid localisation and characterisation of gamma-ray bursts, and discoveries of infant and extreme supernovae beyond the traditional core-collapse and thermonuclear regimes. I will also present our efforts to automate and expedite the characterisation of transients via algorithmically scheduled follow-up and citizen scientists.
- Speaker: Joseph Lyman, University of Warwick
- Thursday 12 June 2025, 16:00-17:00
- Venue: Hoyle Lecture Theatre, Institute of Astronomy.
- Series: Institute of Astronomy Colloquia; organiser: Matthew Grayling.
Apocalypse When? Hubble Casts Doubt on Certainty of Galactic Collision
- Hubble Home
- Overview
- Impact & Benefits
- Science
- Observatory
- Team
- Multimedia
- News
- More
NASA, ESA, the Hubble Heritage (STScI/AURA)-ESA/Hubble Collaboration, and B. Whitmore (STScI)
As far back as 1912, astronomers realized that the Andromeda galaxy — then thought to be only a nebula — was headed our way. A century later, astronomers using NASA’s Hubble Space Telescope were able to measure the sideways motion of Andromeda and found it was so negligible that an eventual head-on collision with the Milky Way seemed almost certain.
A smashup between our own galaxy and Andromeda would trigger a firestorm of star birth, supernovae, and maybe toss our Sun into a different orbit. Simulations had suggested it was as inevitable as, in the words of Benjamin Franklin, “death and taxes.”
But now a new study using data from Hubble and the European Space Agency’s (ESA) Gaia space telescope says “not so fast.” Researchers combining observations from the two space observatories re-examined the long-held prediction of a Milky Way – Andromeda collision, and found it is far less inevitable than astronomers had previously suspected.
“We have the most comprehensive study of this problem today that actually folds in all the observational uncertainties,” said Till Sawala, astronomer at the University of Helsinki in Finland and lead author of the study, which appears today in the journal Nature Astronomy.
His team includes researchers at Durham University, United Kingdom; the University of Toulouse, France; and the University of Western Australia. They found that there is approximately a 50-50 chance of the two galaxies colliding within the next 10 billion years. They based this conclusion on computer simulations using the latest observational data.
These galaxy images illustrate three possible encounter scenarios between our Milky Way and the neighboring Andromeda galaxy. Top left: Galaxies M81 and M82. Top right: NGC 6786, a pair of interacting galaxies. Bottom: NGC 520, two merging galaxies. Science: NASA, ESA, STScI, DSS, Till Sawala (University of Helsinki); Image Processing: Joseph DePasquale (STScI)Sawala emphasized that predicting the long-term future of galaxy interactions is highly uncertain, but the new findings challenge the previous consensus and suggest the fate of the Milky Way remains an open question.
“Even using the latest and most precise observational data available, the future of the Local Group of several dozen galaxies is uncertain. Intriguingly, we find an almost equal probability for the widely publicized merger scenario, or, conversely, an alternative one where the Milky Way and Andromeda survive unscathed,” said Sawala.
The collision of the two galaxies had seemed much more likely in 2012, when astronomers Roeland van der Marel and Tony Sohn of the Space Telescope Science Institute in Baltimore, Maryland published a detailed analysis of Hubble observations over a five-to-seven-year period, indicating a direct impact in no more than 5 billion years.
“It’s somewhat ironic that, despite the addition of more precise Hubble data taken in recent years, we are now less certain about the outcome of a potential collision. That’s because of the more complex analysis and because we consider a more complete system. But the only way to get to a new prediction about the eventual fate of the Milky Way will be with even better data,” said Sawala.
100,000 Crash-Dummy SimulationsAstronomers considered 22 different variables that could affect the potential collision between our galaxy and our neighbor, and ran 100,000 simulations called Monte Carlo simulations stretching to 10 billion years into the future.
“Because there are so many variables that each have their errors, that accumulates to rather large uncertainty about the outcome, leading to the conclusion that the chance of a direct collision is only 50% within the next 10 billion years,” said Sawala.
“The Milky Way and Andromeda alone would remain in the same plane as they orbit each other, but this doesn’t mean they need to crash. They could still go past each other,” said Sawala.
Researchers also considered the effects of the orbits of Andromeda’s large satellite galaxy, M33, and a satellite galaxy of the Milky Way called the Large Magellanic Cloud (LMC).
“The extra mass of Andromeda’s satellite galaxy M33 pulls the Milky Way a little bit more towards it. However, we also show that the LMC pulls the Milky Way off the orbital plane and away from Andromeda. It doesn’t mean that the LMC will save us from that merger, but it makes it a bit less likely,” said Sawala.
In about half of the simulations, the two main galaxies fly past each other separated by around half a million light-years or less (five times the Milky Way’s diameter). They move outward but then come back and eventually merge in the far future. The gradual decay of the orbit is caused by a process called dynamical friction between the vast dark-matter halos that surround each galaxy at the beginning.
In most of the other cases, the galaxies don’t even come close enough for dynamical friction to work effectively. In this case, the two galaxies can continue their orbital waltz for a very long time.
The new result also still leaves a small chance of around 2% for a head-on collision between the galaxies in only 4 to 5 billion years. Considering that the warming Sun makes Earth uninhabitable in roughly 1 billion years, and the Sun itself will likely burn out in 5 billion years, a collision with Andromeda is the least of our cosmic worries.
The Hubble Space Telescope has been operating for over three decades and continues to make ground-breaking discoveries that shape our fundamental understanding of the universe. Hubble is a project of international cooperation between NASA and ESA (European Space Agency). NASA’s Goddard Space Flight Center in Greenbelt, Maryland, manages the telescope and mission operations. Lockheed Martin Space, based in Denver, also supports mission operations at Goddard. The Space Telescope Science Institute in Baltimore, which is operated by the Association of Universities for Research in Astronomy, conducts Hubble science operations for NASA.
Explore MoreHubble Provides Bird’s-Eye View of Andromeda Galaxy’s Ecosystem (2025)
Hubble Shows Milky Way is Destined for Head-on Collision with Andromeda Galaxy (2012)
Galaxy Details and Mergers
Hubble Traces Hidden History of Andromeda Galaxy (2025)
Hubble’s High-Definition Panoramic View of the Andromeda Galaxy (2015)
Facebook logo @NASAHubble @NASAHubble Instagram logo @NASAHubble Related Images & Videos Milky Way and Andromeda Encounters
This selection of images of external galaxies illustrates three encounter scenarios between our Milky Way and the neighboring Andromeda galaxy. Top left: Galaxies M81 and M82. Top right: NGC 6786, a pair of interacting galaxies. Bottom: NGC 520, two merging galaxies.
Contact Media
Claire Andreoli
NASA’s Goddard Space Flight Center
Greenbelt, Maryland
claire.andreoli@nasa.gov
Ray Villard
Space Telescope Science Institute
Baltimore, Maryland
- Hubble Space Telescope
- Andromeda Galaxy
- Astrophysics
- Astrophysics Division
- Galaxies
- Goddard Space Flight Center
- Interacting Galaxies
- The Milky Way
- The Universe
A Star Like No Other
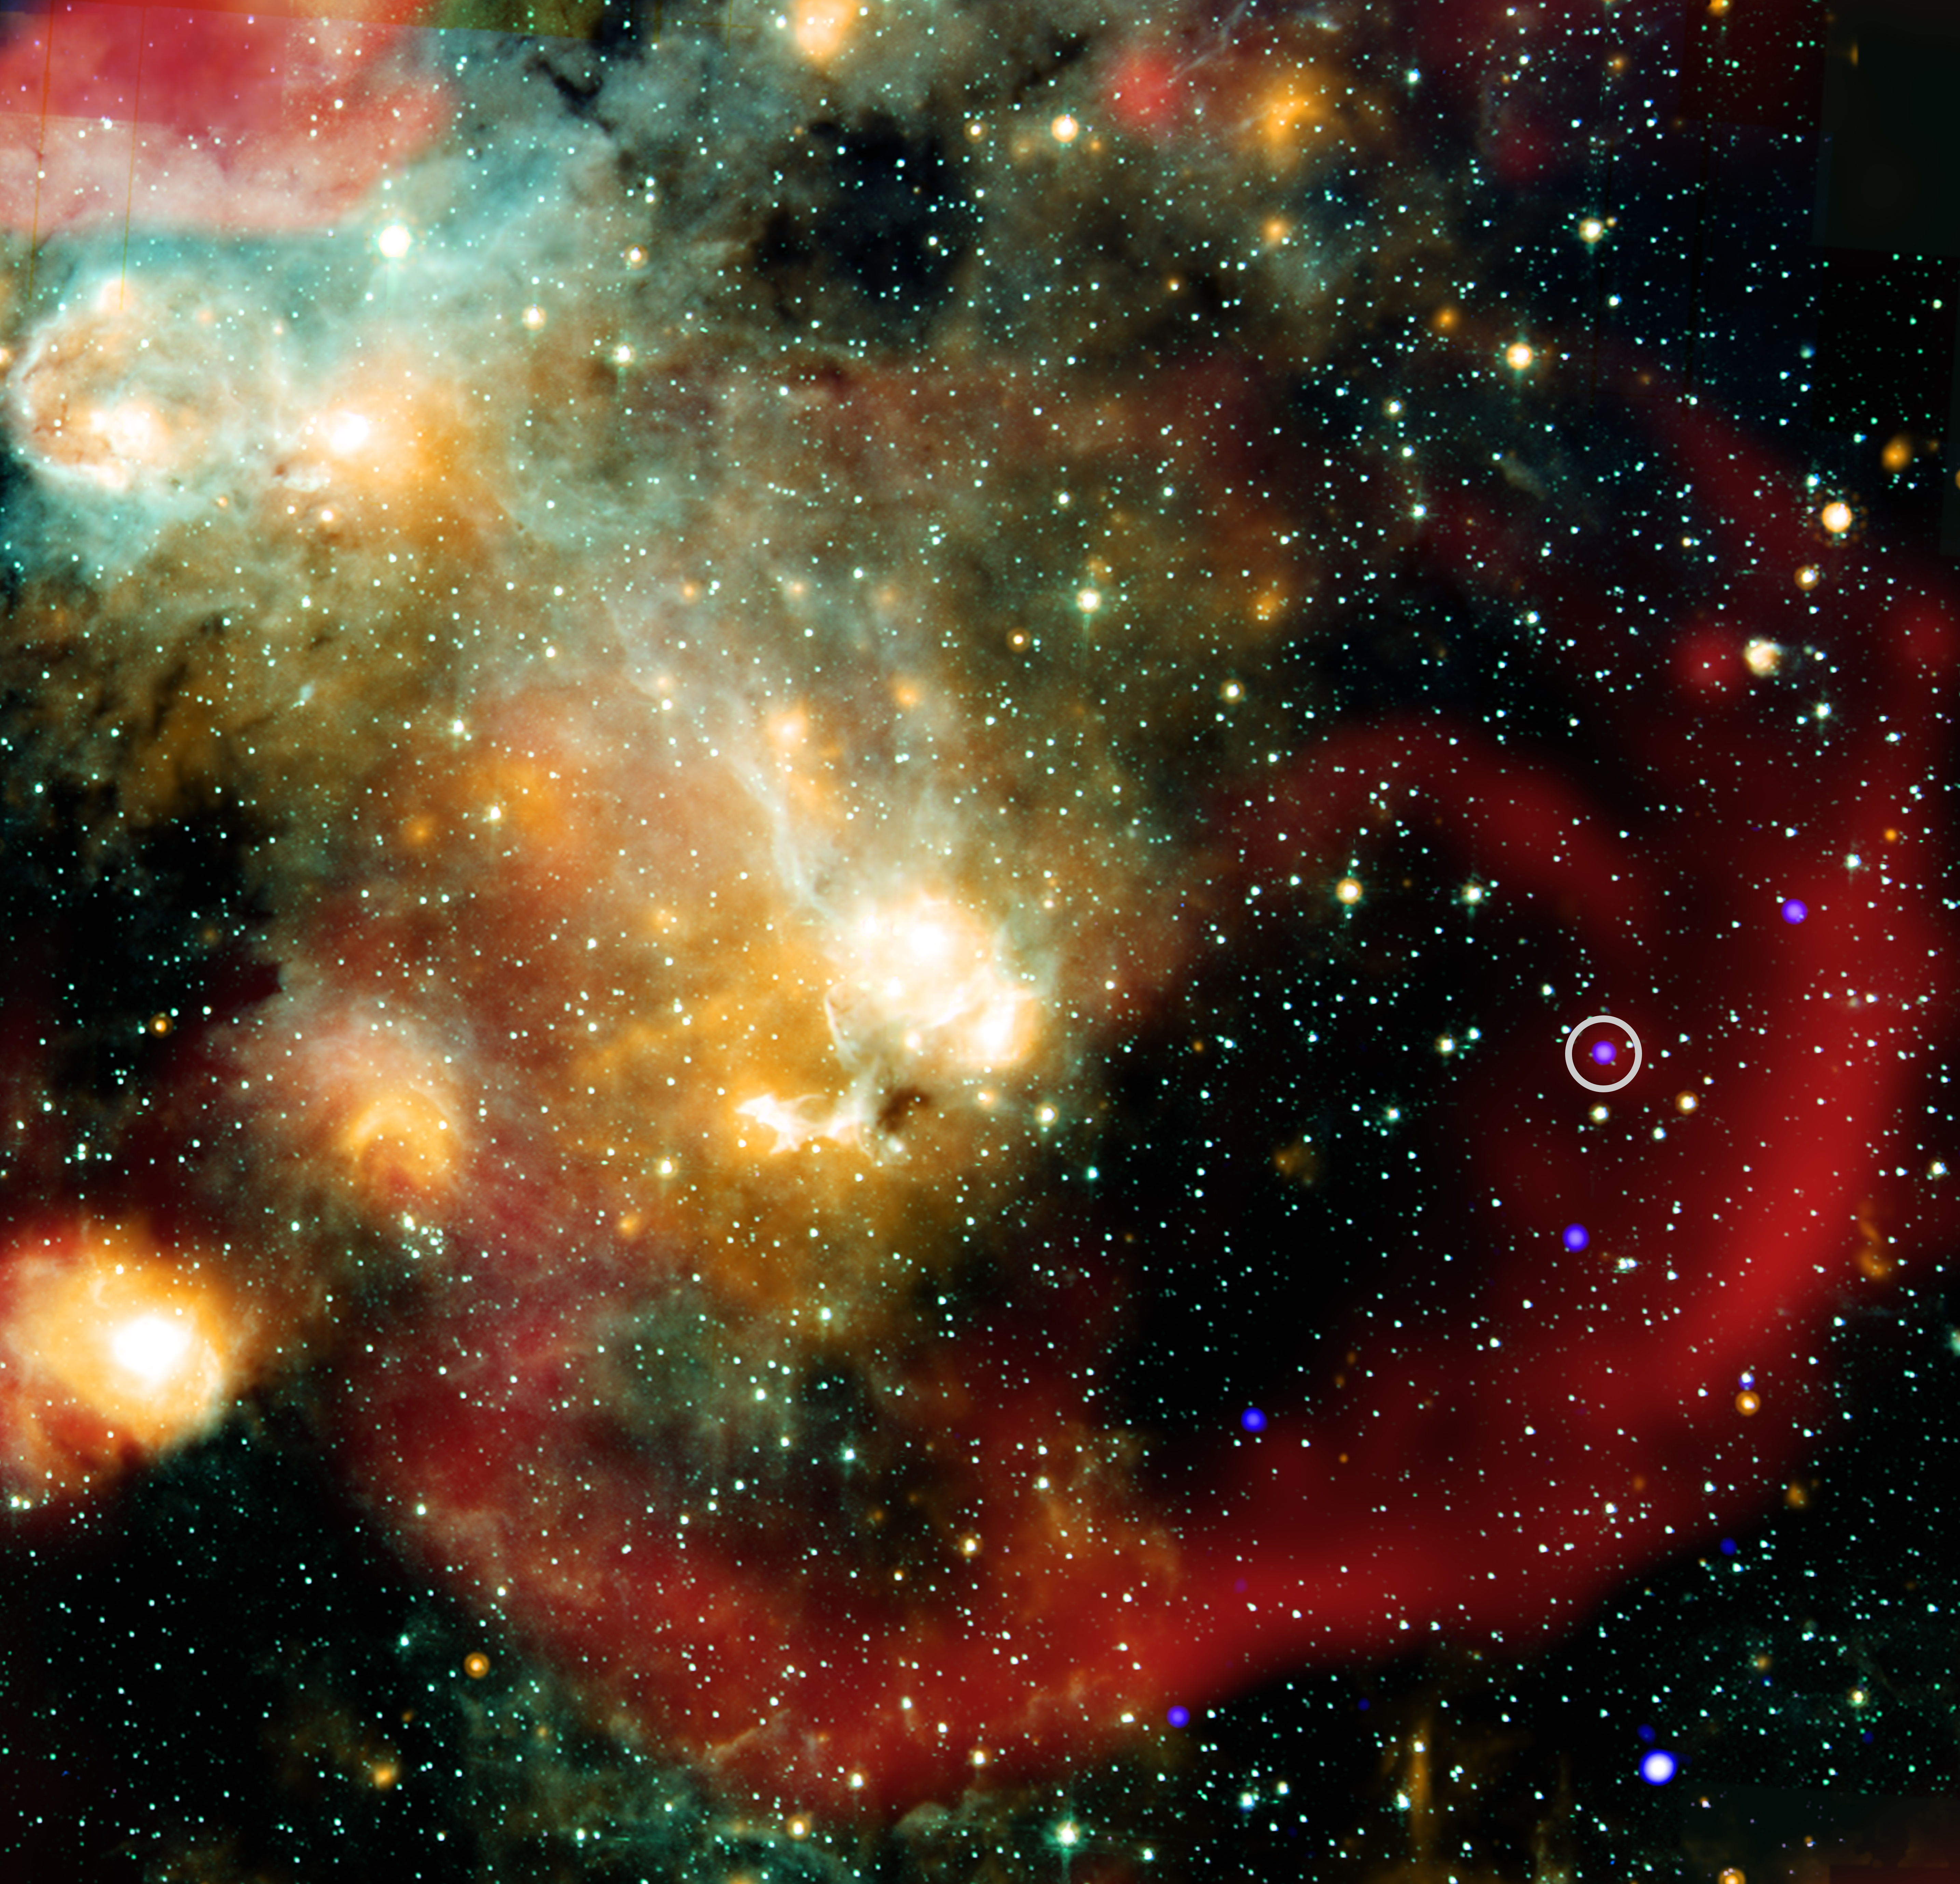
An unusual star (circled in white at right) behaving like no other seen before and its surroundings are featured in this composite image released on May 28, 2025. A team of astronomers combined data from NASA’s Chandra X-ray Observatory and the Square Kilometer Array Pathfinder (ASKAP) radio telescope on Wajarri Country in Australia to study the discovered object, known as ASKAP J1832−0911 (ASKAP J1832 for short).
ASKAP J1832 belongs to a class of objects called “long period radio transients” discovered in 2022 that vary in radio wave intensity in a regular way over tens of minutes. This is thousands of times longer than the length of the repeated variations seen in pulsars, which are rapidly spinning neutron stars that have repeated variations multiple times a second. ASKAP J1832 cycles in radio wave intensity every 44 minutes, placing it into this category of long period radio transients. Using Chandra, the team discovered that ASKAP J1832 is also regularly varying in X-rays every 44 minutes. This is the first time that such an X-ray signal has been found in a long period radio transient.
Image credit: X-ray: NASA/CXC/ICRAR, Curtin Univ./Z. Wang et al.; Infrared: NASA/JPL/CalTech/IPAC; Radio: SARAO/MeerKAT; Image processing: NASA/CXC/SAO/N. Wolk
Thu 05 Jun 16:00: The Formation and Co-Evolution of Galaxies and Supermassive Black Holes
Cosmological hydrodynamical simulations are becoming increasingly realistic by incorporating a wider range of physical processes, higher spatial resolution, and larger statistical samples. Despite ongoing trade-offs between resolution and volume, recent advances now allow for simulations that resolve the multiphase interstellar medium and capture the clumpy nature of star formation in galaxies. In this context, I will present how such simulations shed light on the coupled evolution of galaxies and their central supermassive black holes. At high redshift, galaxies tend to be gas-rich, turbulent, and star-bursting, often exhibiting irregular, compact, and disturbed morphologies. As internal turbulence subsides, many systems transition into stable, rotating disc galaxies, typically once they reach stellar masses around 1e10 Msun. Simultaneously, black hole growth is tightly linked to the dynamical state of the host galaxy. In low-mass, turbulent systems, stellar feedback can suppress nuclear gas inflows, delaying black hole growth. Only when galaxies become sufficiently massive and dynamically settled can gas efficiently reach galactic centers to fuel sustained accretion. These processes also have important implications for the spin evolution of black holes or how fast they coalesce, which can reflect the varying modes of accretion and feedback across cosmic time.
- Speaker: Yohan Dubois (Institut d’Astrophysique de Paris)
- Thursday 05 June 2025, 16:00-17:00
- Venue: Hoyle Lecture Theatre, Institute of Astronomy.
- Series: Institute of Astronomy Colloquia; organiser: Matthew Grayling.
Fri 06 Jun 11:30: Exploring the End of Reionization
Abstract not available
- Speaker: George Becker (UC Riverside)
- Friday 06 June 2025, 11:30-12:30
- Venue: Ryle Seminar Room, KICC + online.
- Series: Galaxies Discussion Group; organiser: Sandro Tacchella.
Wed 11 Jun 13:15: Neurodiversity and Communication Styles
Dr Maria Dias, Neurodiversity Adviser at the Accessibility and Disability Resource Centre (ADRC) and St Catharine’s College, will explore how people with different neurotypes communicate in unique ways, and why understanding these differences is important for creating more inclusive and supportive environments. Whether you’re neurodivergent yourself, work with neurodivergent people, or just want to learn more, this talk is for you. There will be time for questions and open discussion at the end.
- Speaker: Maria Dias, Neurodiversity Adviser at the Accessibility and Disability Resource Centre (ADRC) and St Catharine’s College
- Wednesday 11 June 2025, 13:15-14:05
- Venue: The Hoyle Lecture Theatre + Zoom .
- Series: Institute of Astronomy Seminars; organiser: Cristiano Longarini.