Chance of asteroid hitting Moon increases slightly
Hubble Spots Stellar Sculptors in Nearby Galaxy
- Hubble Home
- Overview
- Impact & Benefits
- Science
- Observatory
- Team
- News
- Multimedia
- More
As part of ESA/Hubble’s 35th anniversary celebrations, the European Space Agency (ESA) is sharing a new image series revisiting stunning, previously released Hubble targets with the addition of the latest Hubble data and new processing techniques.
This new image showcases the dazzling young star cluster NGC 346. Although both the James Webb Space Telescope and Hubble have released images of NGC 346 previously, this image includes new data and is the first to combine Hubble observations made at infrared, optical, and ultraviolet wavelengths into an intricately detailed view of this vibrant star-forming factory.
This dazzling NASA/ESA Hubble Space Telescope image features the young star cluster NGC 346. ESA/Hubble & NASA, A. Nota, P. Massey, E. Sabbi, C. Murray, M. Zamani (ESA/Hubble)NGC 346 is in the Small Magellanic Cloud, a satellite galaxy of the Milky Way that lies 200,000 light-years away in the constellation Tucana. The Small Magellanic Cloud is less rich in elements heavier than helium — what astronomers call metals — than the Milky Way. This makes conditions in the galaxy similar to what existed in the early universe.
NGC 346 is home to more than 2,500 newborn stars. The cluster’s most massive stars, which are many times more massive than our Sun, blaze with an intense blue light in this image. The glowing pink nebula and snakelike dark clouds are sculpted by the luminous stars in the cluster.
Hubble’s exquisite sensitivity and resolution were instrumental in uncovering the secrets of NGC 346’s star formation. Using two sets of observations taken 11 years apart, researchers traced the motions of NGC 346’s stars, revealing them to be spiraling in toward the center of the cluster. This spiraling motion arises from a stream of gas from outside of the cluster that fuels star formation in the center of the turbulent cloud.
The inhabitants of this cluster are stellar sculptors, carving out a bubble within the nebula. NGC 346’s hot, massive stars produce intense radiation and fierce stellar winds that pummel the billowing gas of their birthplace, dispersing the surrounding nebula.
The nebula, named N66, is the brightest example of an H II (pronounced ‘H-two’) region in the Small Magellanic Cloud. H II regions are set aglow by ultraviolet light from hot, young stars like those in NGC 346. The presence of this nebula indicates the young age of the star cluster, as an H II region shines only as long as the stars that power it — a mere few million years for the massive stars pictured here.
The Hubble Space Telescope has been operating for over three decades and continues to make ground-breaking discoveries that shape our fundamental understanding of the universe. Hubble is a project of international cooperation between NASA and ESA (European Space Agency). NASA’s Goddard Space Flight Center in Greenbelt, Maryland, manages the telescope and mission operations. Lockheed Martin Space, based in Denver, also supports mission operations at Goddard. The Space Telescope Science Institute in Baltimore, which is operated by the Association of Universities for Research in Astronomy, conducts Hubble science operations for NASA.
Facebook logo @NASAHubble @NASAHubble Instagram logo @NASAHubble Explore Hubble NGC 346 Images and Science Download the image above NASA’s Hubble Finds Spiraling Stars, Providing Window into Early Universe Young Stars Sculpt Gas with Powerful Outflows in the Small Magellanic Cloud Hubble’s Black and White View Infant Stars in the Small Magellanic Cloud Hubble Captures Unique Ultraviolet View of a Spectacular Star Cluster Share Details Last Updated Apr 04, 2025 EditorAndrea GianopoulosLocationNASA Goddard Space Flight Center Contact MediaClaire Andreoli
NASA’s Goddard Space Flight Center
Greenbelt, Maryland
claire.andreoli@nasa.gov
Bethany Downer
ESA/Hubble Chief Science Communications Officer
bethany.downer@esahubble.org
- Hubble Space Telescope
- Astrophysics
- Astrophysics Division
- Goddard Space Flight Center
- Nebulae
- Stars
- The Universe
Keep Exploring Discover More Topics From Hubble Hubble Space Telescope
Acoustic modes in M67 cluster stars trace deepening convective envelopes
Nature, Published online: 02 April 2025; doi:10.1038/s41586-025-08760-2
Measuring acoustic oscillations in 27 stars within the M67 cluster presents evidence of a rapidly evolving convective zone as stars evolve from subgiants to red giants.X-ray Clues Reveal Destroyed Planet
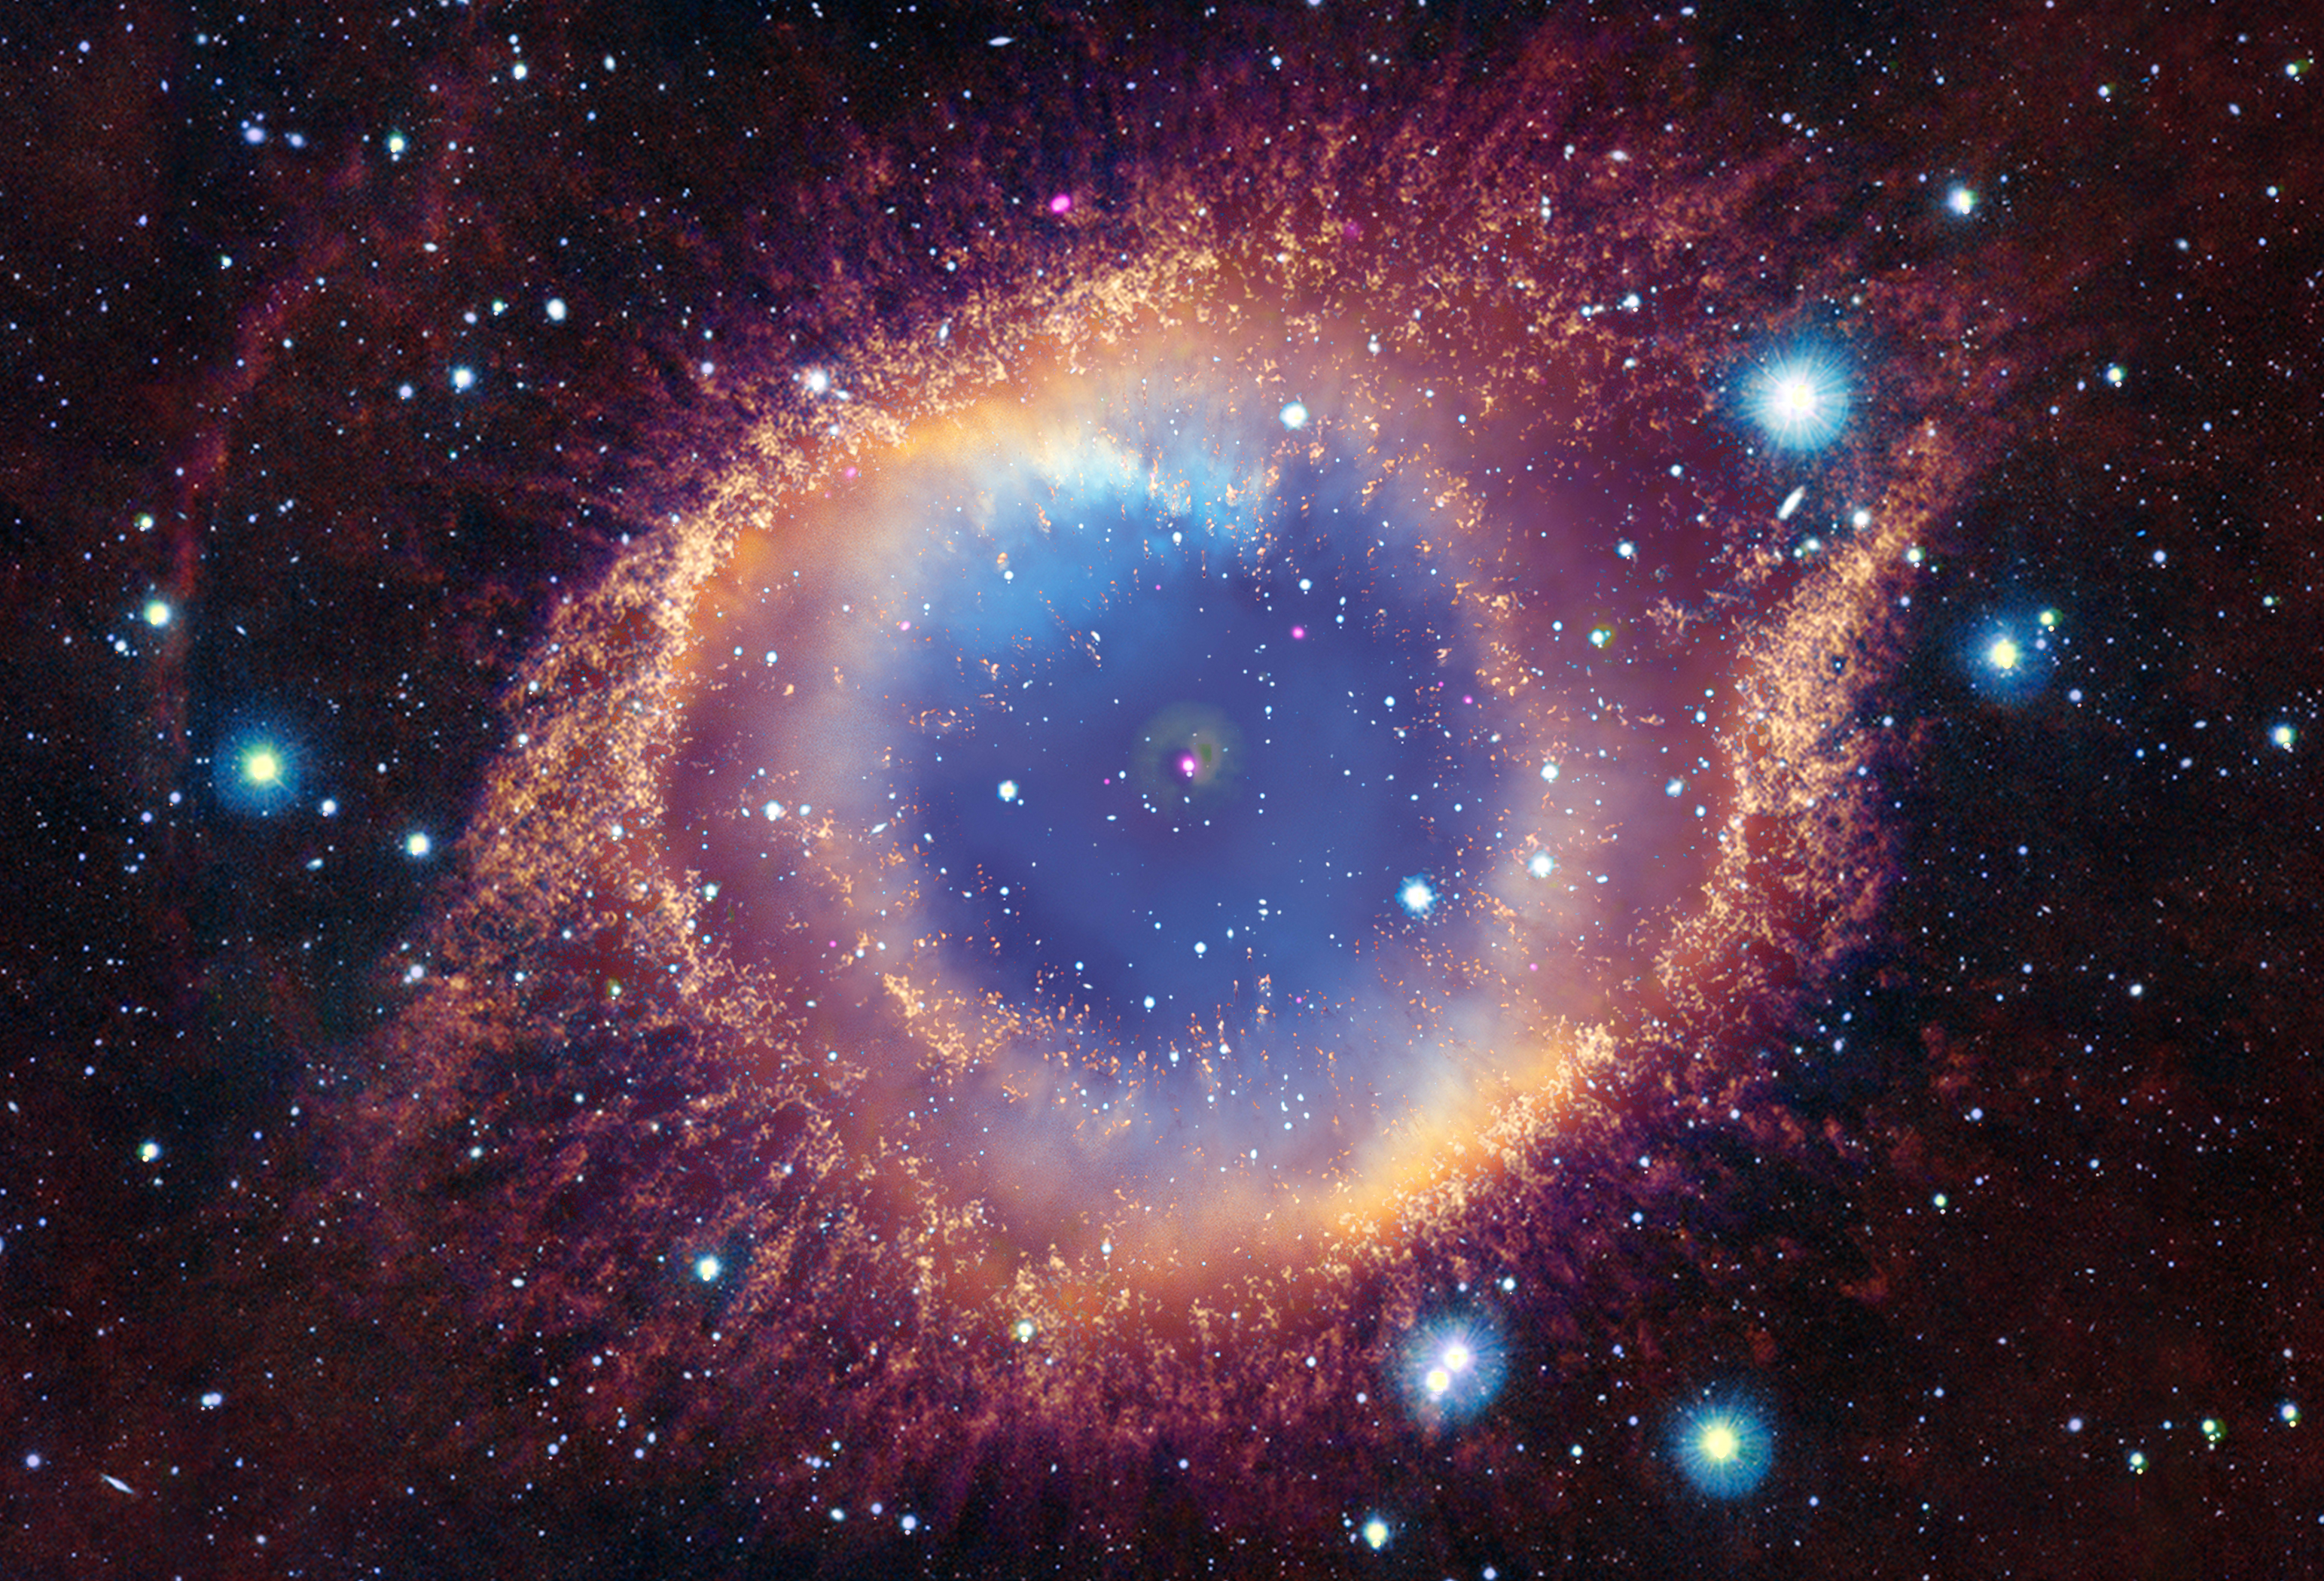
This image of the Helix Nebula, released on March 4, 2025, shows a potentially destructive white dwarf at the nebula’s center: this star may have destroyed a planet. This has never been seen before – and could explain a mysterious X-ray signal that astronomers have detected from the nebula for over 40 years.
This view combines X-rays from NASA’s Chandra X-ray Observatory (magenta), optical light data from NASA’s Hubble Space Telescope (orange, light blue), infrared data from the European Southern Observatory VISTA telescope (gold, dark blue), and ultraviolet data from GALEX (purple) of the Helix Nebula. Data from Chandra indicates that this white dwarf has destroyed a very closely orbiting planet.
Image credit: X-ray: NASA/CXC/SAO/Univ Mexico/S. Estrada-Dorado et al.; Ultraviolet: NASA/JPL; Optical: NASA/ESA/STScI (M. Meixner)/NRAO (T.A. Rector); Infrared: ESO/VISTA/J. Emerson; Image Processing: NASA/CXC/SAO/K. Arcand
What’s Up: April 2025 Skywatching Tips from NASA
- Science
- Skywatching
- What’s Up: April 2025…
Enjoy observing planets in the morning and evening sky, look for Lyrid meteors, and hunt for the “faint fuzzy” wonder that is the distant and ancient city of stars known as globular cluster M3.
Skywatching HighlightsAll Month – Planet Visibility:
- Mercury: Visible for a few days in the second half of April, extremely low in the east before sunrise.
- Venus: Rising low in the east in the hour before dawn.
- Mars: Bright and easy to view after dark all month. Setting a couple of hours after midnight.
- Jupiter: Bright and easy to spot in the west after dark, setting a couple of hours after sunset.
- Saturn: Visible low in the east below Venus, before dawn in the last two weeks of April.
Daily Highlights:
April 1 & 30 – Jupiter & Crescent Moon: Find the charming pair in the west as the sky darkens, setting about 3 hours after sunset.
April 4 & 5 – Mars & Moon: The Moon, around its first quarter phase, appears near Mars in the sky for two nights.
April 24-25 – Grouping of the Moon & Three Planets: Find Venus, Saturn, and the crescent moon gathered low in the east as dawn warms the morning sky. Mercury is also visible below them for those with a clear view to the horizon.
All month – Venus: Earth’s hothouse twin planet has made the shift from an evening object to a morning sight. You’ll notice it rising low in the east before dawn, looking a little higher each morning through the month.
All month – Mars: Looking bright and reddish in color, Mars is visible high overhead after dark all month. At the start of the month it lies along a line with bright stars Procyon and Pollux, but you’ll notice it moves noticeably over the course of April (~12 degrees or the width of your outstretched fist at arm’s length).
TranscriptWhat’s Up for April? Planets at dusk and dawn, April showers, and observing a distant city of stars.
Sky chart showing Jupiter and the crescent Moon on April 1. A similar scene repeats on April 30, but with the Moon appearing above Jupiter. NASA/JPL-Caltech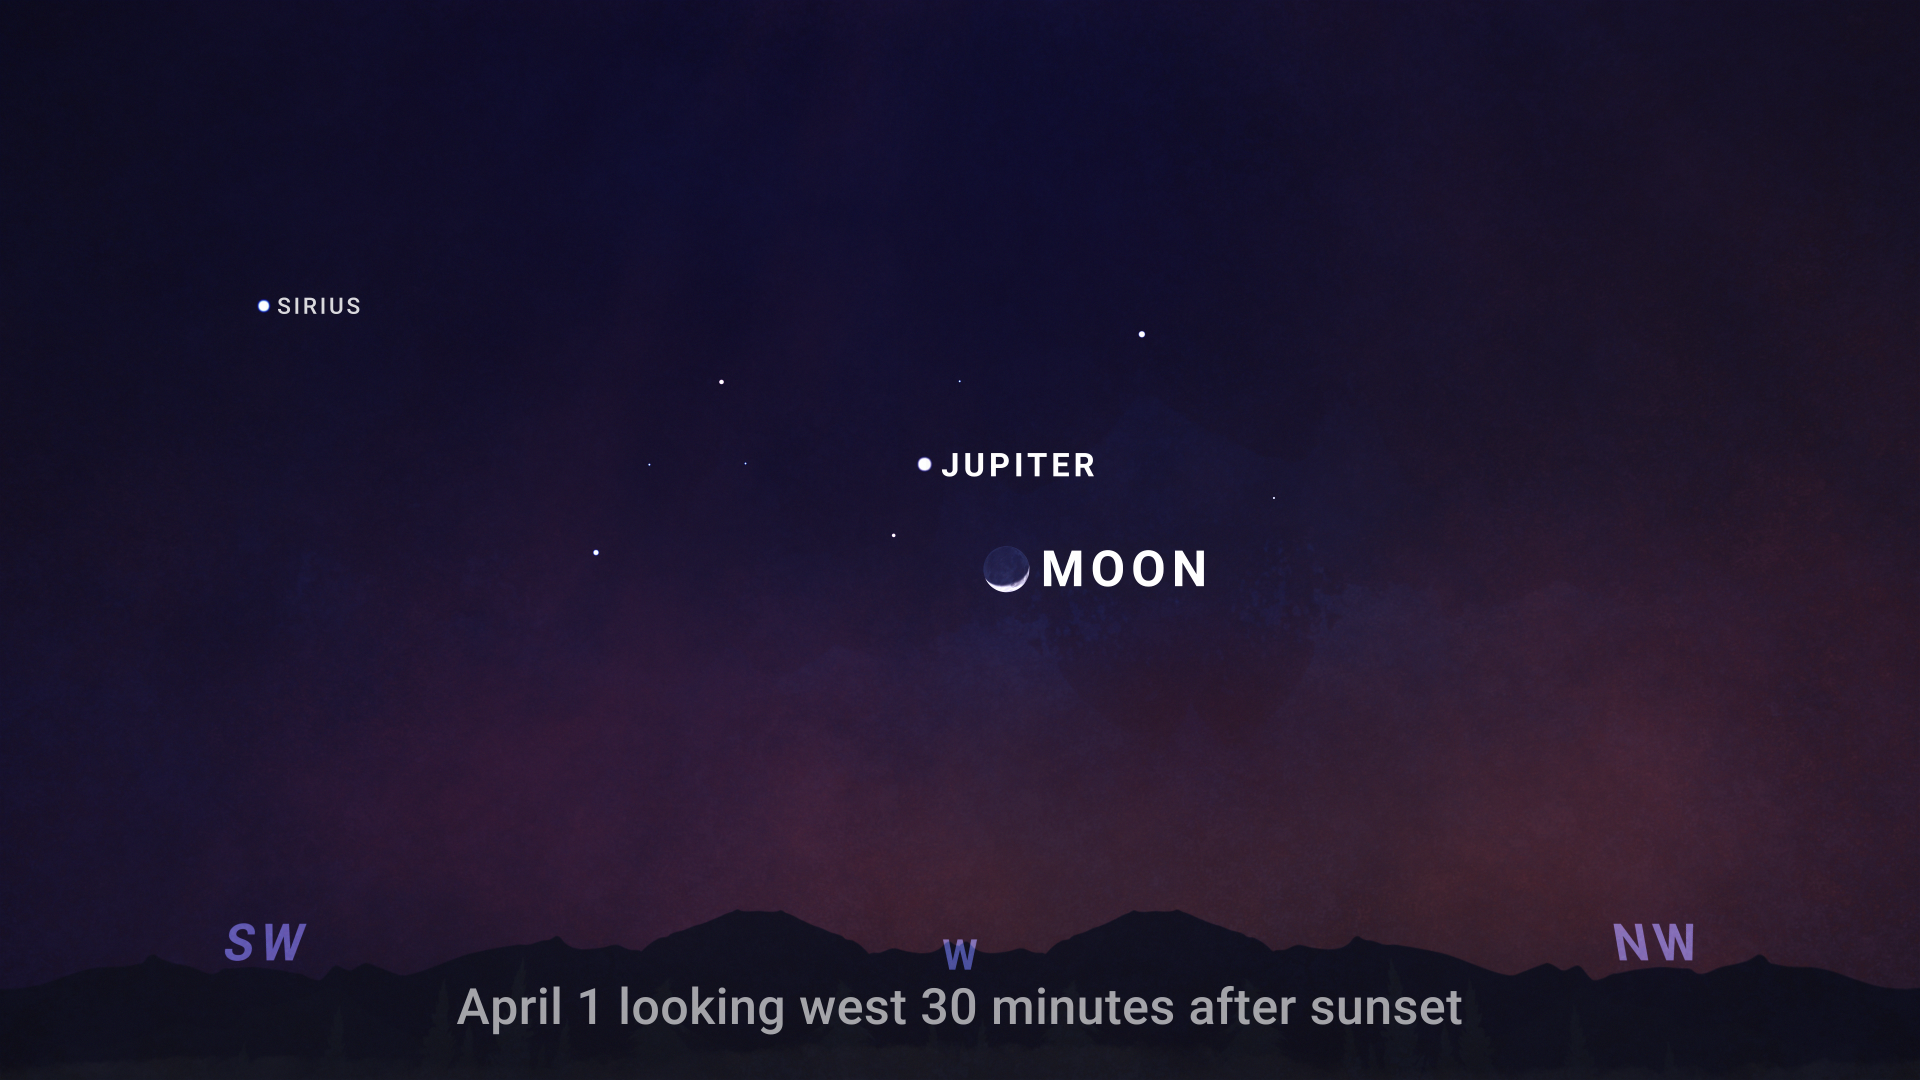
First up, in the evening sky, we begin and end the month with Jupiter and the crescent Moon shining brightly together in the western sky as sunset fades. On both April 1st and 30th, you can find the charming pair about half an hour after sunset, setting about 3 hours later.
Mars is high overhead in the south on April evenings. At the start of the month, it’s directly in between bright stars Procyon and Pollux, but it moves noticeably during the month. You’ll find the first-quarter moon right next to Mars on April 4th and 5th.
Moving to the morning sky, Venus has now made the switch from an evening object to a morning one. You may start to notice it rising low in the east before dawn, looking a little higher each morning through the month.
Sky chart showing the eastern sky 45 minutes before sunrise on April 24, with Venus, Saturn and the crescent Moon forming a grouping low in the sky. Mercury might also be visible for those with a completely clear view to the horizon. NASA/JPL-Caltech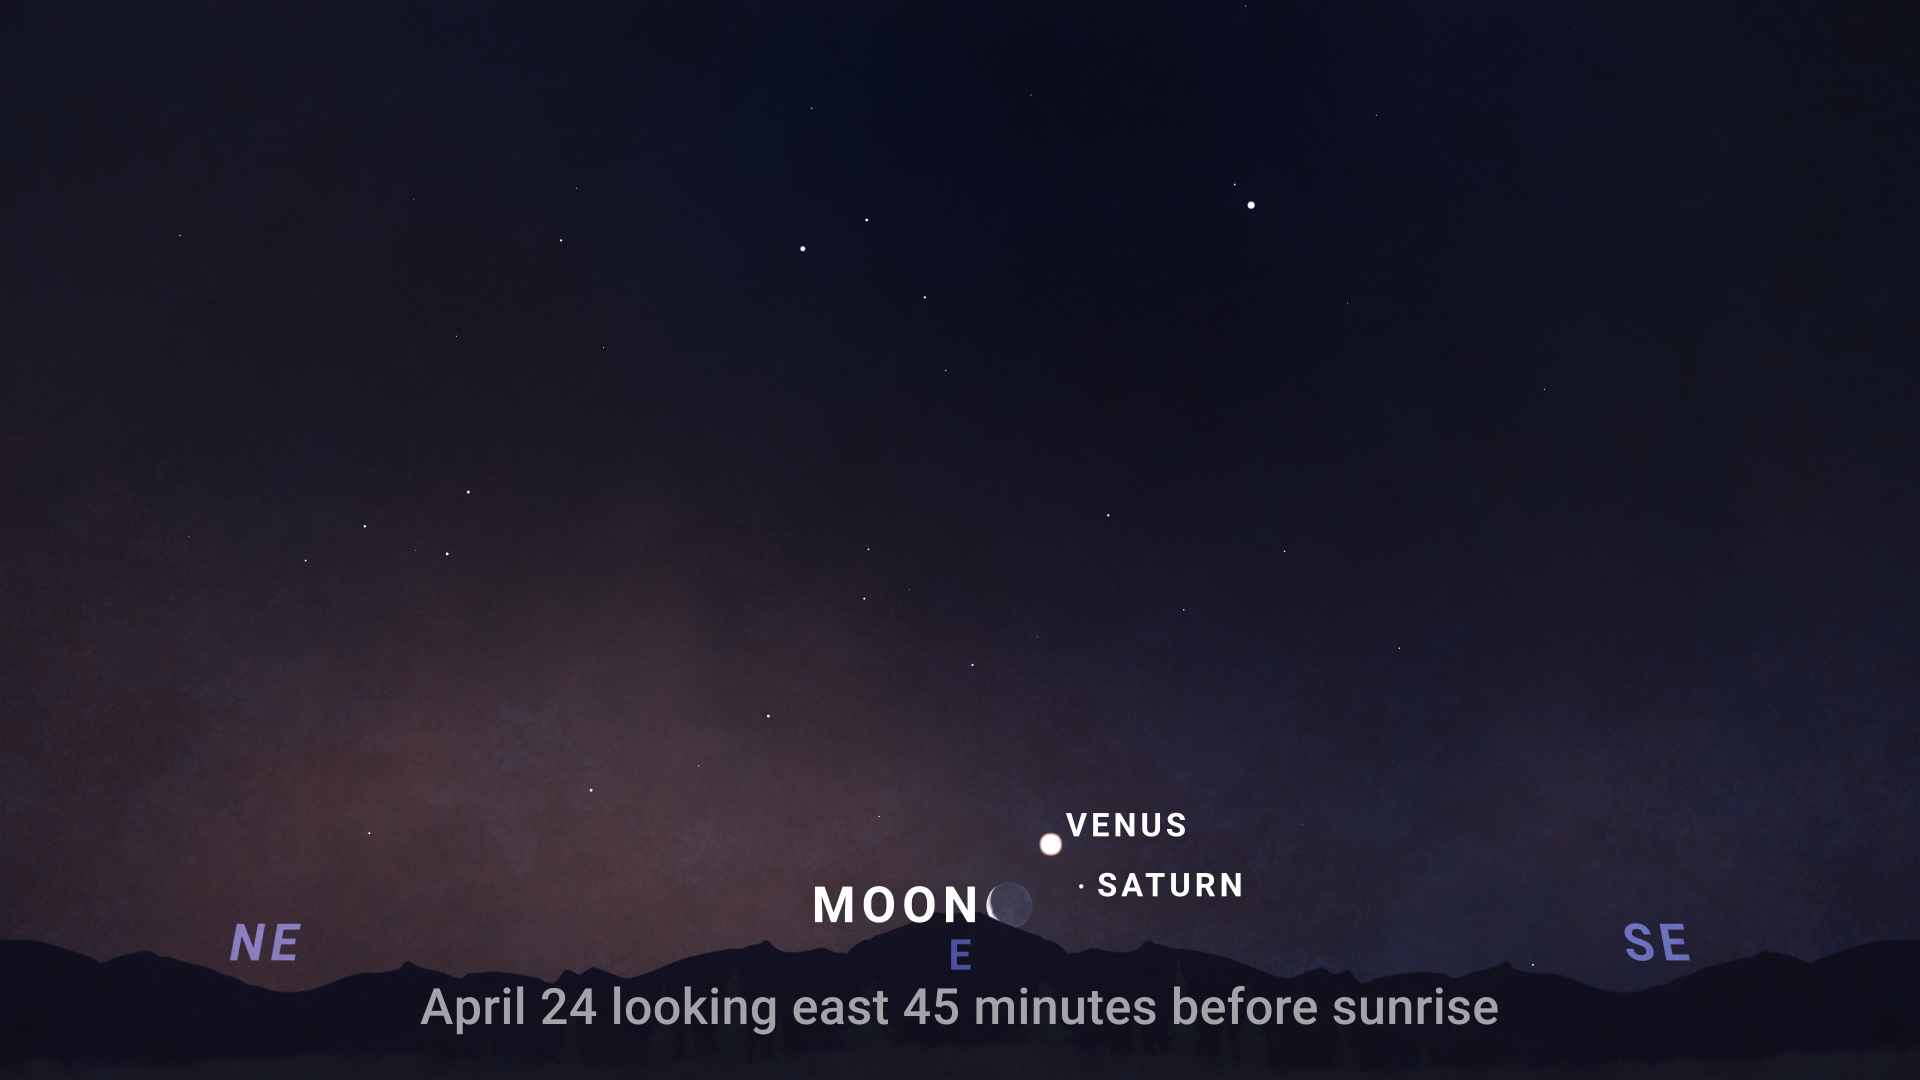
Around April 24th and 25th, you’ll find Venus, Saturn, and the crescent moon gathered low in the east as dawn warms up the morning sky. Those with a clear view to the horizon might also pick out Mercury looking bright, but very low in the sky.
April brings shooting stars as Earth passes through one the streams of comet dust that create our annual meteor showers. The Lyrids are a modest meteor shower that peaks overnight on April 21st and into the morning of the 22nd. You can expect up to 15 meteors per hour near the peak under dark skies.
The Lyrids are best observed from the Northern Hemisphere, but can be seen from south of the equator as well. View them after about 10:30pm local time until dawn, with the best viewing around 5 a.m. The waning crescent moon will rise around 3:30am, but at only 27% full, it shouldn’t interfere too much with your meteor watching. For the best experience, face roughly toward the east, lie down in a safe, dark place away from bright lights, and look straight overhead. Meteors can appear anywhere in the sky, and some Lyrids can leave bright trails that last for a few seconds after they’ve passed.
NASA studies meteors from the ground, in the air, and from orbit to forecast meteor activity and protect spacecraft, and to understand the composition of comets and asteroids throughout our solar system.
Sky chart facing east around 9pm in April 2025 showing the location of globular cluster M3. The chart depicts the cluster’s position relative to the Big Dipper and bright stars Arcturus and Cor Caroli. The Big Dipper star Megrez serves as an indicator for the brightness of Cor Caroli. For easy visibility, M3 is depicted brighter and larger than its actual appearance. NASA/JPL-Caltech
April offers a chance to observe a truly distant wonder – a globular cluster known as “M3.” It’s a vast collection of stars that lies 34,000 light-years from Earth in our galaxy’s outer reaches. Astronomer Charles Messier discovered this object in 1764, while searching for new comets. Realizing it wasn’t one, he added it to his list of interesting objects that were not comets, which today we know as Messier’s catalog.
Through binoculars, Messier 3, or M3, appears as a small, fuzzy, star-like patch of light. With a small telescope, you’ll see a more defined glow with a slightly grainy texture. And with telescopes 8 inches or larger, the cluster begins to resolve into hundreds of individual stars.
Now, globular clusters contain some of the oldest stars in the universe, often over 10 billion years old. Unlike open clusters like the Pleiades, which sit within the Milky Way’s spiral arms, globular clusters are found in the galaxy’s halo, orbiting far above and below the Milky Way’s disk. Our galaxy has around 150 confirmed globular clusters. M3 itself is probably 11 to 13 billion years old and contains around half a million stars. And it’s relatively easy to spot in April under dark skies with binoculars or a small telescope.
Finding M3 starts with the Big Dipper. Facing east, use the Dipper’s handle to “arc to Arcturus,” the fourth-brightest star in the night sky. From there, look higher in the sky to find the star Cor Caroli located here to the west of the Dipper’s handle. It’s about as bright as this star in the Dipper’s cup. M3 is located roughly a third of the way from Arcturus to Cor Caroli. With binoculars or a finder scope, sweep within this area until you spot a faint, round glow.
M3 is an excellent target for beginners and seasoned observers alike. Whether using binoculars or a telescope, you’ll be rewarded with a view of one of the oldest objects in our galaxy.
The phases of the Moon for April 2025. NASA/JPL-Caltech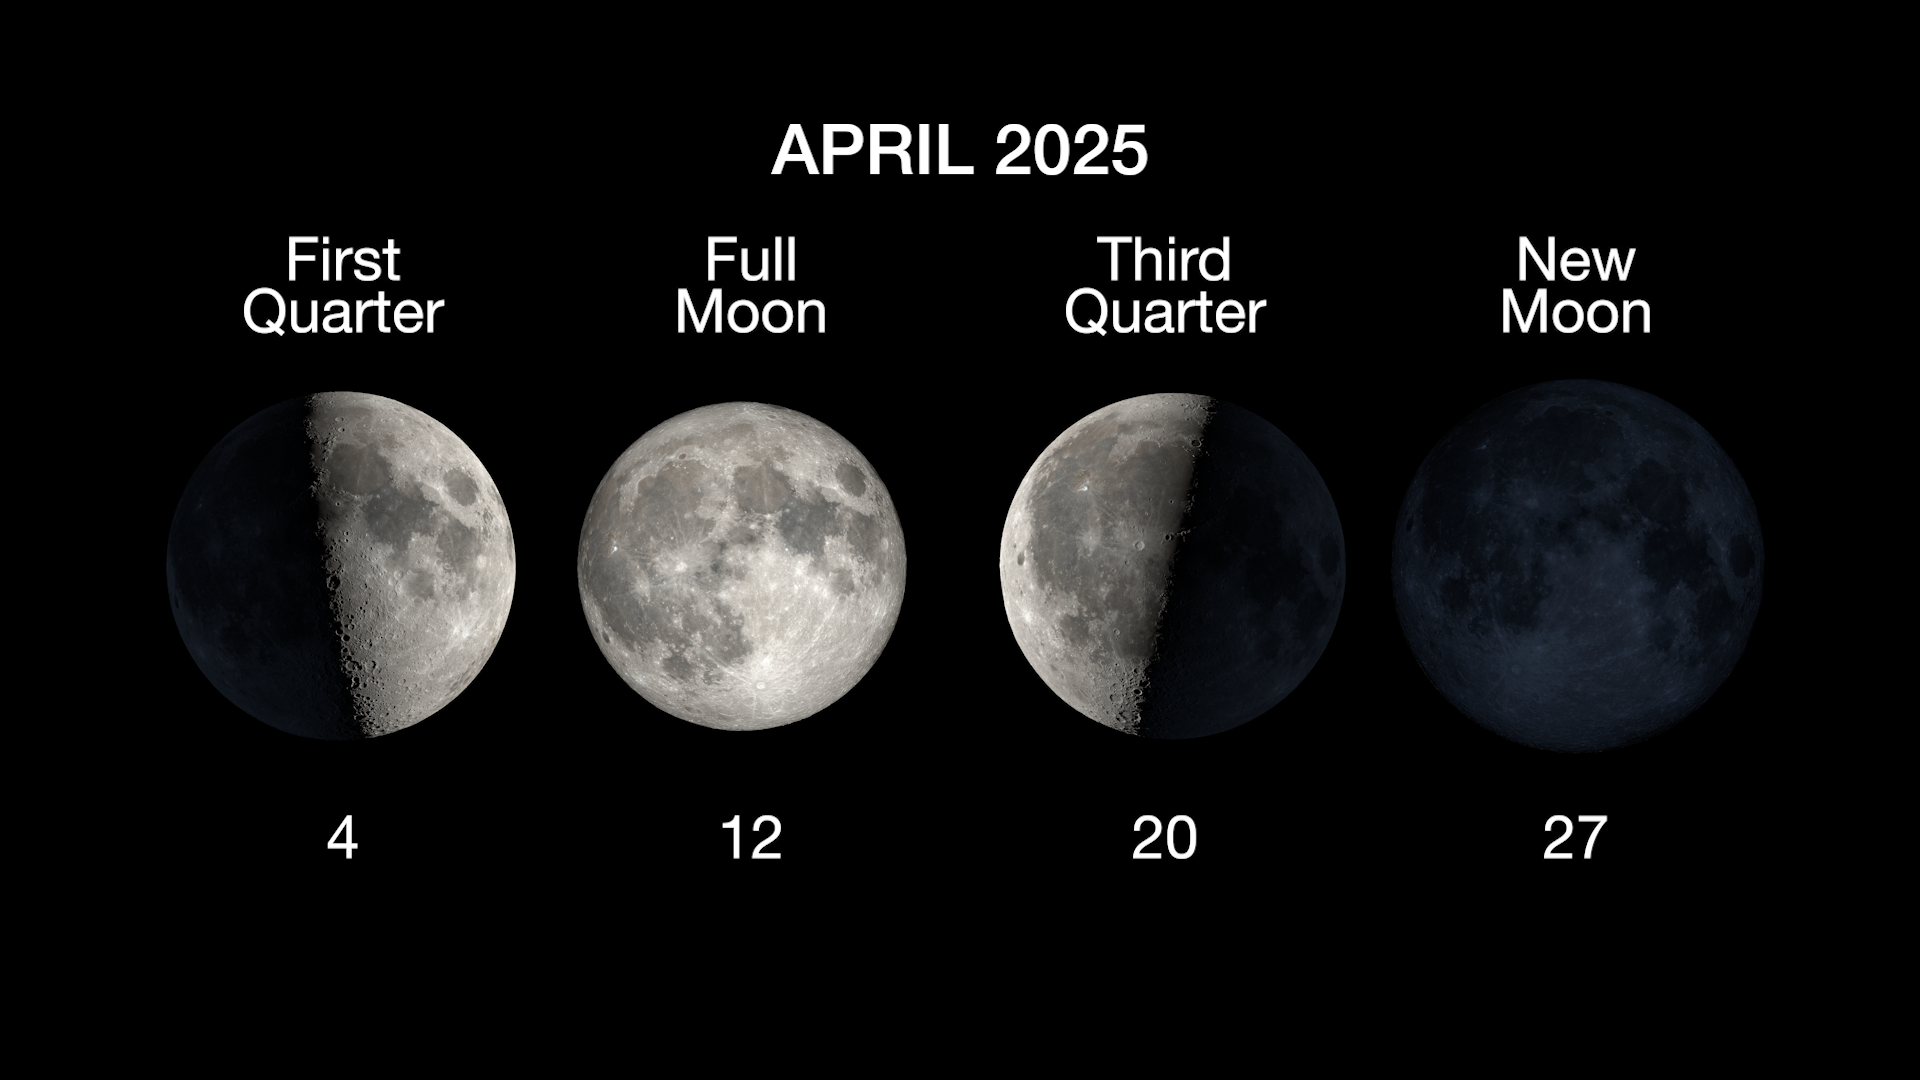
Above are the phases of the Moon for April.
Stay up to date on all of NASA’s missions exploring the solar system and beyond at NASA Science. I’m Preston Dyches from NASA’s Jet Propulsion Laboratory, and that’s What’s Up for this month.
Keep Exploring Discover More Topics From NASAHow nothing could destroy the universe
Old Missions, New Discoveries: NASA’s Data Archives Accelerate Science
5 min read
Old Missions, New Discoveries: NASA’s Data Archives Accelerate Science This montage of images taken by the Voyager spacecraft of the planets and four of Jupiter’s moons is set against a false-color picture of the Rosette Nebula with Earth’s moon in the foreground. Archival data from the Voyager missions continue to produce new scientific discoveries. NASA/JPL/ASU
Every NASA mission represents a leap into the unknown, collecting data that pushes the boundaries of human understanding. But the story doesn’t end when the mission concludes. The data carefully preserved in NASA’s archives often finds new purpose decades later, unlocking discoveries that continue to benefit science, technology, and society.
“NASA’s science data is one of our most valuable legacies,” said Kevin Murphy, NASA’s chief science data officer at NASA Headquarters in Washington. “It carries the stories of our missions, the insights of our discoveries, and the potential for future breakthroughs.”
NASA’s science data is one of our most valuable legacies.Kevin Murphy
Chief Science Data Officer, NASA’s Science Mission Directorate
NASA’s Science Mission Directorate manages an immense amount of data, spanning astrophysics, biological and physical sciences, Earth science, heliophysics, and planetary science. Currently, NASA’s science data holdings exceed 100 petabytes—enough to store 20 billion photos from the average modern smartphone. This volume is expected to grow significantly with new missions.
This vast amount of data enables new discoveries, connecting scientific observations together in meaningful ways. Over 50% of scientific publications rely on archived data, which NASA provides to millions of commercial, government, and scientific users.
NASA’s five science divisions — Astrophysics, Biological and Physical Sciences, Earth Science, Heliophysics, and Planetary Science — store petabytes’ worth of data in their archives that enable scientists to continually make discoveries. NASA
Managing and stewarding such massive volumes of information requires careful planning, robust infrastructure, and innovative strategies to ensure the data is accessible, secure, and sustainable. Continued support for data storage and cutting-edge technology is key to ensuring future generations of researchers can continue to explore using science data from NASA missions.
Modern technology, such as image processing and artificial intelligence, helps unlock new insights from previous observations. For example, in 1986, NASA’s Voyager 2 spacecraft conducted a historic flyby of Uranus, capturing detailed data on the planet and its environment. Decades later, in the early 2000s, scientists used advanced image processing techniques on this archival data to discover two small moons, Perdita and Cupid, which had gone unnoticed during the initial analysis.
In 2024, researchers revisited this 38-year-old archival data and identified a critical solar wind event that compressed Uranus’s magnetosphere just before the Voyager 2 flyby. This rare event, happening only about four percent of the time, provided unique insights into Uranus’s magnetic field and its interaction with space weather.
The first panel of this artist’s concept depicts how Uranus’s magnetosphere (its protective bubble) was behaving before Voyager 2’s flyby. The second panel shows that an unusual kind of solar weather was happening at the same time as the spacecraft’s flyby, giving scientists a skewed view of Uranus’s magnetosphere. The work enabled by archival Voyager data contributes to scientists’ understanding of this enigmatic planet. NASA/JPL-Caltech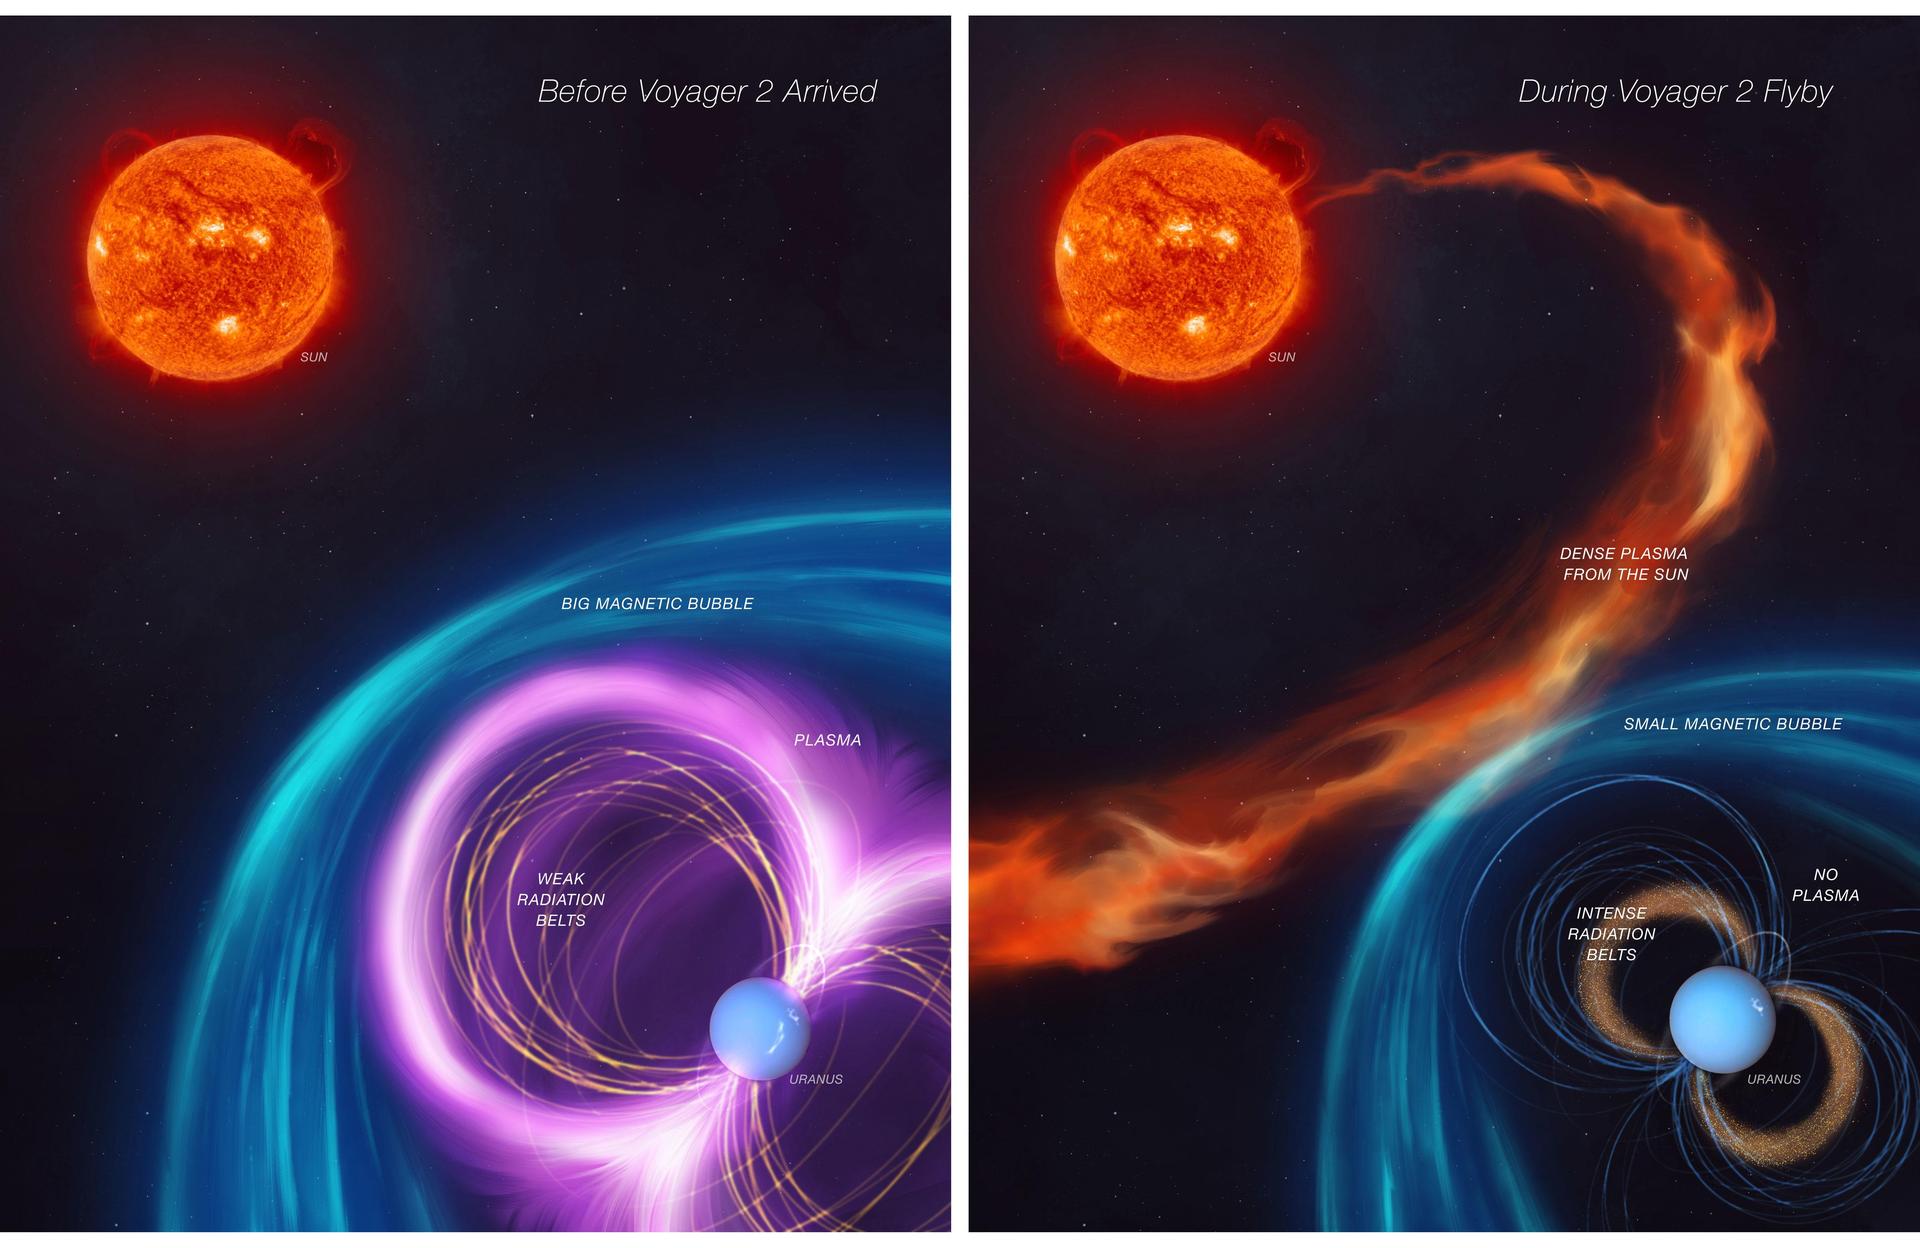
NASA’s Lunar Reconnaissance Orbiter (LRO), launched in 2009, continues to provide data that reshapes our understanding of the Moon. In 2018, scientists analyzing the LRO’s archival data confirmed the presence of water ice in permanently shadowed regions at the Moon’s poles.
In 2024, new studies out of NASA’s Goddard Space Flight Center in Greenbelt, Maryland, showed widespread evidence of water ice within the permanently shadowed regions outside the lunar South Pole, further aiding lunar mission planners. This discovery not only holds implications for lunar exploration but also demonstrates how existing data can yield groundbreaking insights.
Artist rendering of the Lunar Reconnaissance Orbiter (LRO) above the Moon. LRO carries seven instruments that make comprehensive remote sensing observations of the Moon and measurements of the lunar radiation environment. Archival data from LRO continues to help scientists make discoveries about the Moon. NASA/GSFC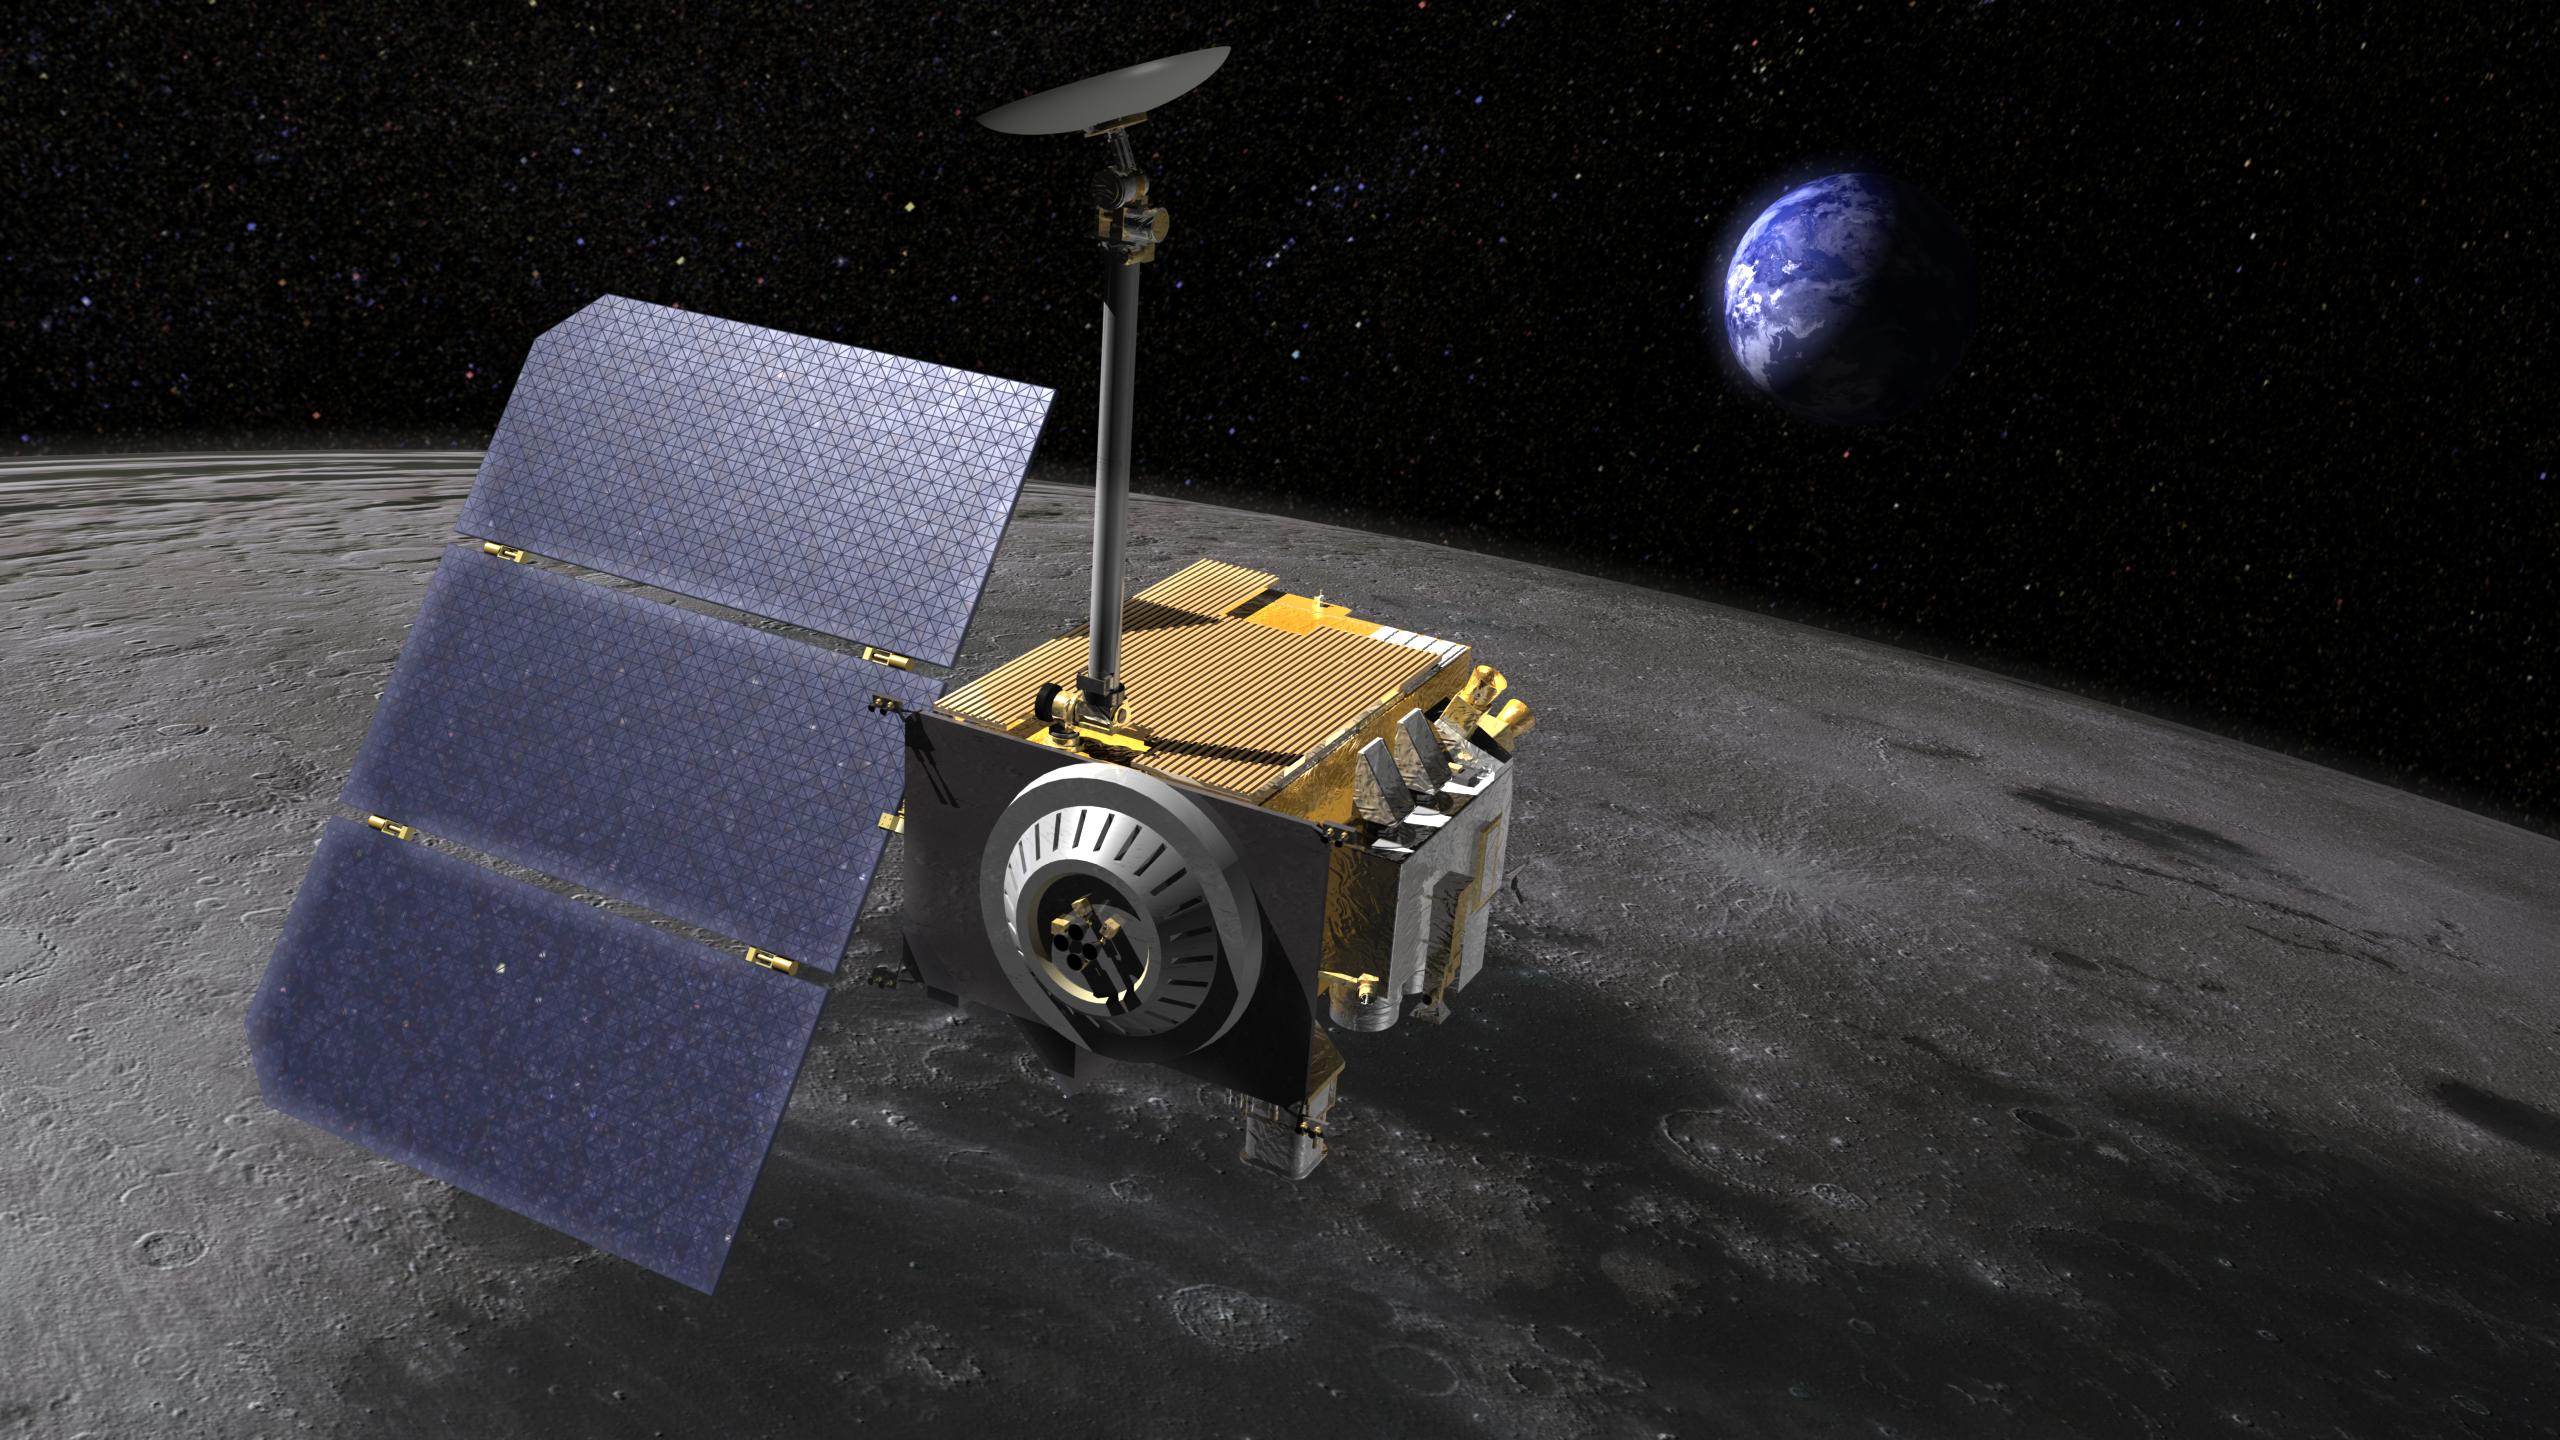
NASA’s data archives uncover the secrets of our own planet as well as others. In 2024, archaeologists published a study revealing a “lost” Mayan city in Campeche, Mexico that was previously unknown to the scientific community. The researchers identified the city in archival airborne Earth science data, including a 2013 dataset from NASA Goddard’s LiDAR Hyperspectral & Thermal Imager (G-LiHT) mission.
The Harmonized Landsat and Sentinel-2 (HLS) project provides frequent high-resolution observations of Earth’s surface. Data from HLS has been instrumental in tracking urban growth over time. By analyzing changes in land cover, researchers have used HLS to monitor the expansion of cities and infrastructure development. For example, in rapidly growing metropolitan areas, HLS data has revealed patterns of urban sprawl, helping planners analyze past trends to predict future metropolitan expansion.
1985 2010
NASA’s Goddard Space Flight Center
NASA’s Goddard Space Flight Center 19852010
NASA’s Goddard Space Flight Center NASA’s Goddard Space Flight Center
1985
2010
Before and After
Urban Growth in Ontario, California1985-2010
CurtainToggle2-Up
Image Details
Thirty-five miles due east of downtown Los Angeles lies the city of Ontario, California. These natural color Landsat 5 images show the massive growth of the city between 1985 and 2010. The airport, found in the southwest portion of the images, added a number of runways, and large warehousing structures now dominate the once rural areas surrounding the airport. In these images, vegetation is green and brown, while urban structures are bright white and gray. A large dry riverbed in the northeast corner is also bright white, but its nonlinear appearance sets it apart visually. Researchers use archival data from Landsat and other satellites to track the growth of cities like Ontario, CA over time.
These discoveries represent only a fraction of what’s possible. NASA is investing in new technologies to harness the full potential of its data archives, including artificial intelligence (AI) foundation models—open-source AI tools designed to extract new findings from existing science data.
“Our vision is to develop at least one AI model for each NASA scientific discipline, turning decades of legacy data into a treasure trove of discovery,” said Murphy. “By embedding NASA expertise into these tools, we ensure that our scientific data continues to drive innovation across science, industry, and society for generations to come.”
Developed under a collaboration between NASA’s Office of the Chief Science Data Officer, IBM, and universities, these AI models are scientifically validated and adaptable to new datasets, making them invaluable for researchers and industries alike.
“It’s like having a virtual assistant that leverages decades of NASA’s knowledge to make smarter, quicker decisions,” said Murphy.
On June 22, 2013, the Operational Land Imager (OLI) on Landsat 8 captured this false-color image of the East Peak fire burning in southern Colorado near Trinidad. Burned areas appear dark red, while actively burning areas look orange. Dark green areas are forests; light green areas are grasslands. Data from Landsat 8 were used to train the Prithvi artificial intelligence model, which can help detect burn scars. NASA Earth Observatory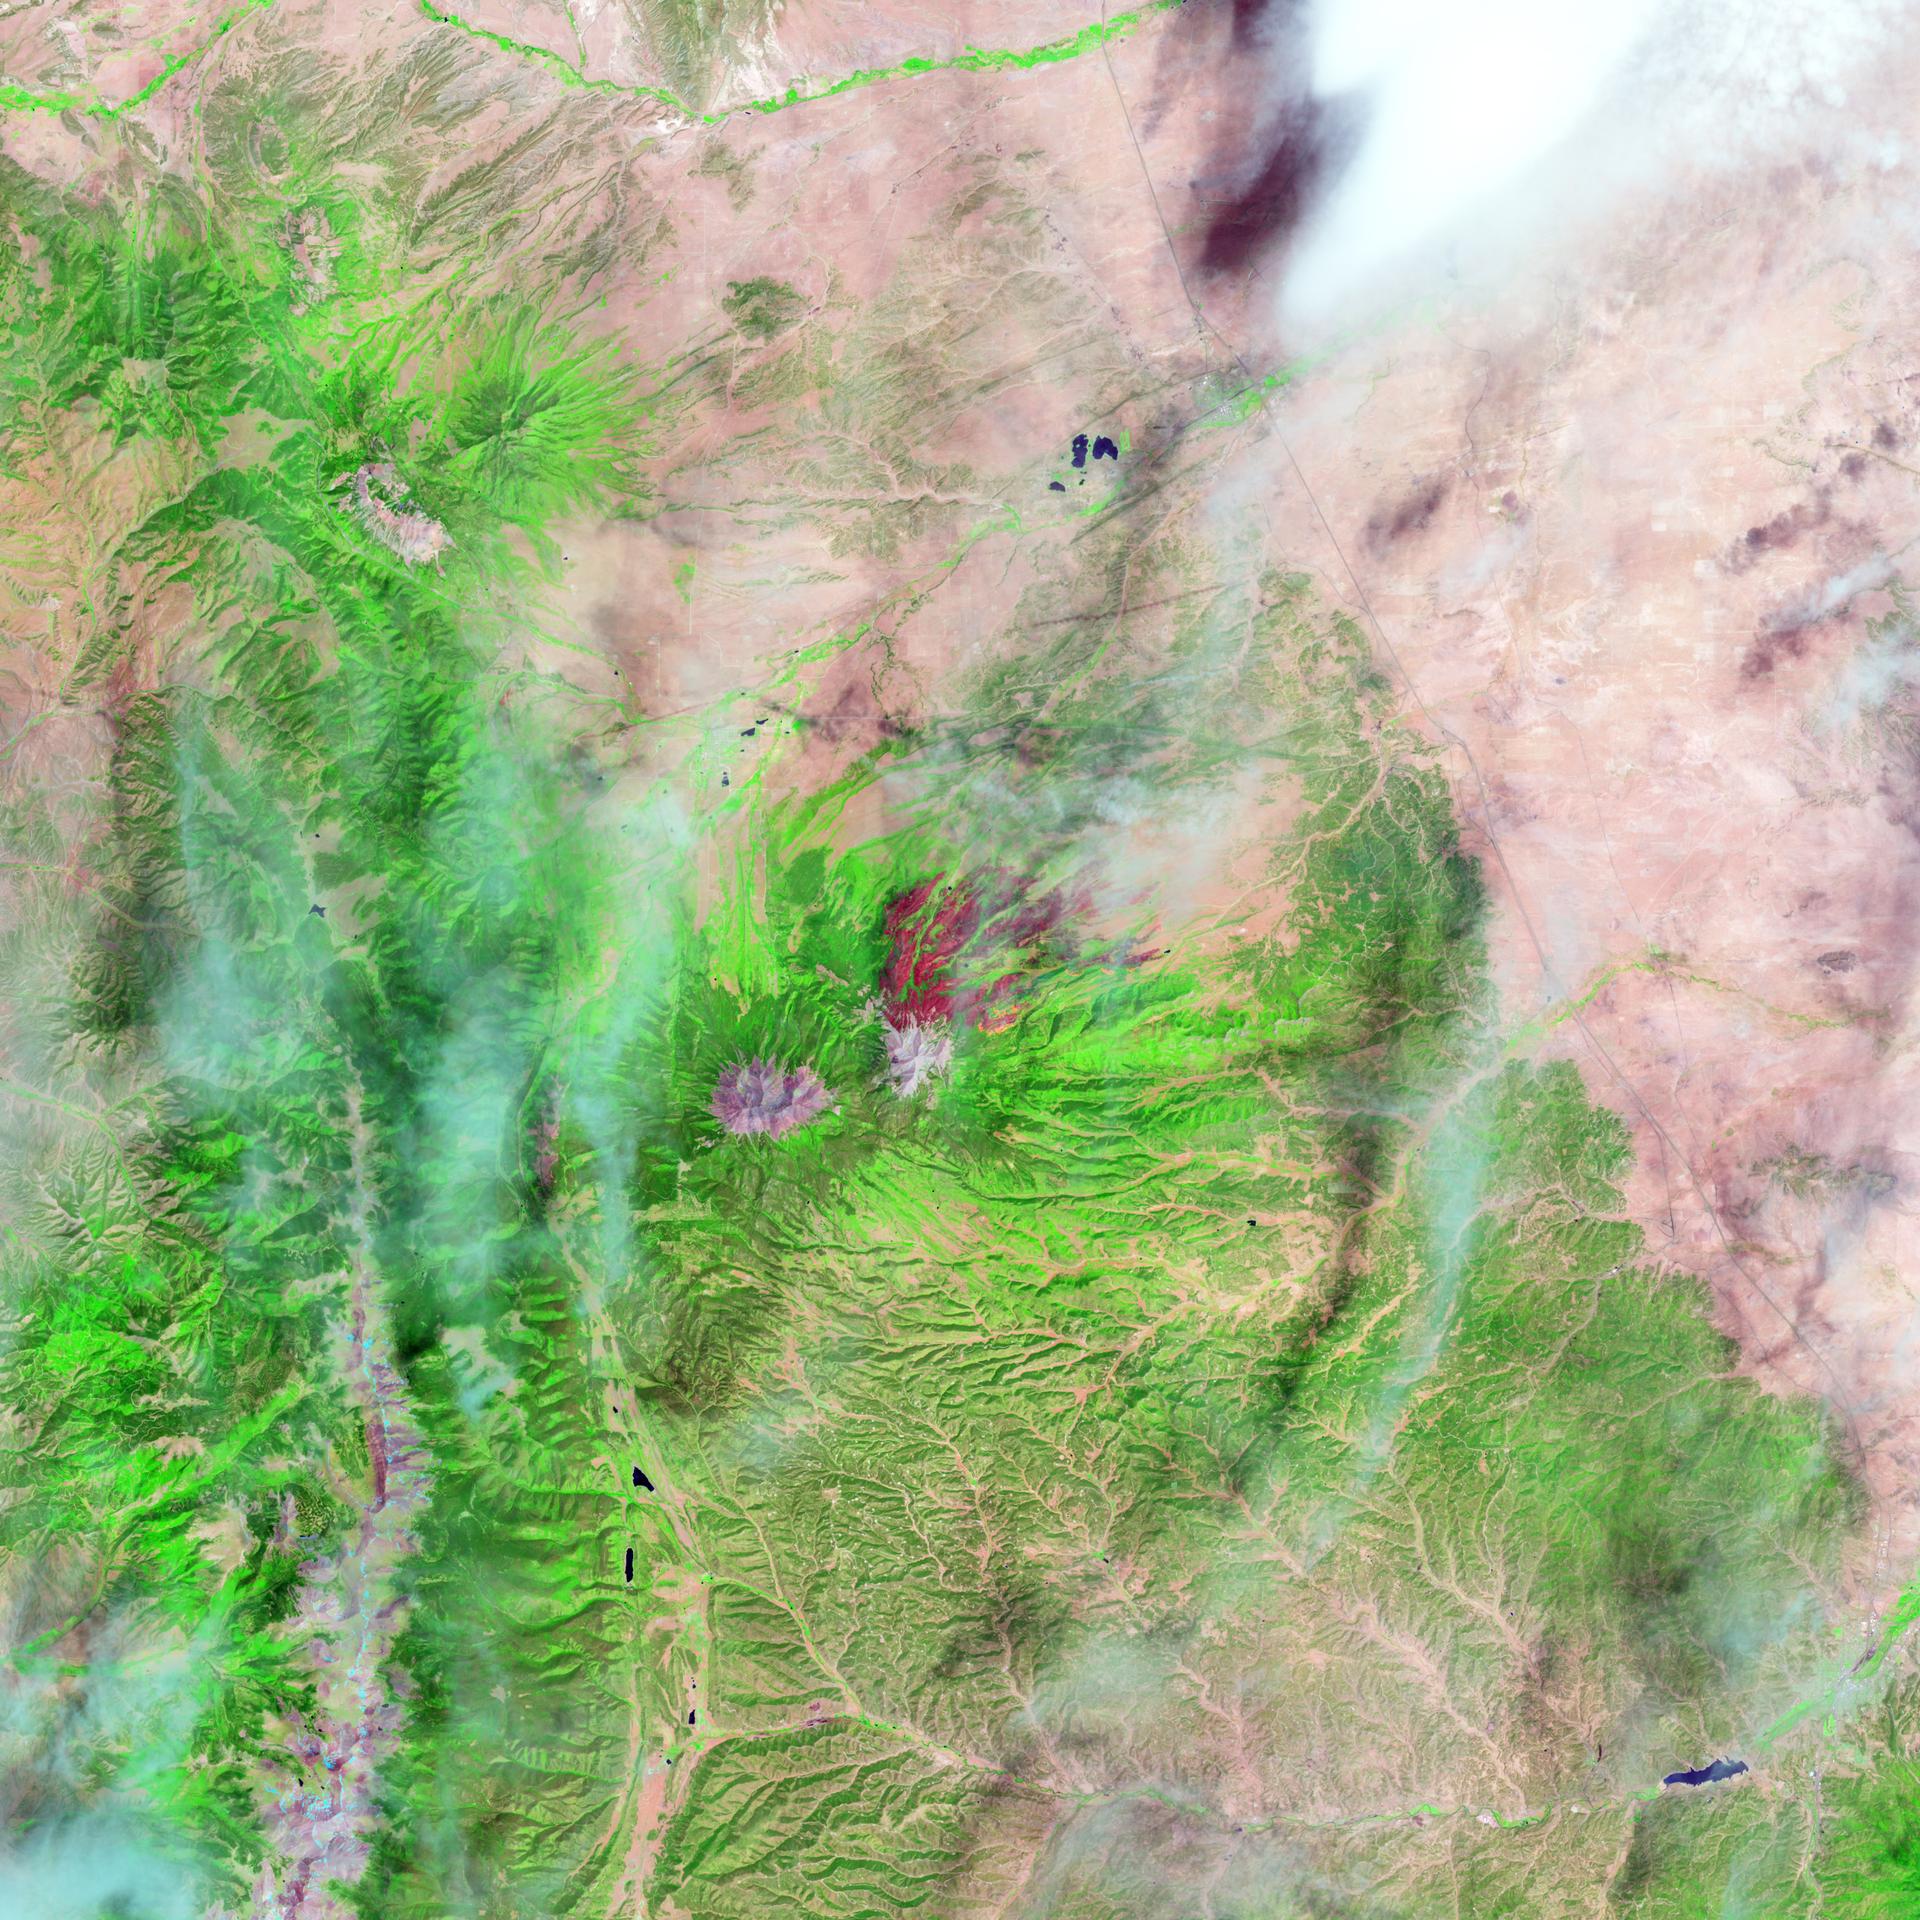
The team’s Earth science foundation models—the Prithvi Geospatial model and Prithvi Weather model—analyze vast datasets to monitor Earth’s changing landscape, track weather patterns, and support critical decision-making processes.
Building on this success, the team is now developing a foundation model for heliophysics. This model will unlock new insights about the dynamics of solar activity and space weather, which can affect satellite operations, communication systems, and even power grids on Earth. Additionally, a model designed for the Moon is in progress, aiming to enhance our understanding of lunar resources and environments.
This investment in AI not only shortens the “data-to-discovery” timeline but also ensures that NASA’s data archives continue to drive innovation. From uncovering new planets to informing future exploration and supporting industries on Earth, the possibilities are boundless.
By maintaining extensive archives and embracing cutting-edge technologies, the agency ensures that the data collected today will continue to inspire and inform discoveries far into the future. In doing so, NASA’s legacy science data truly remains the gift that keeps on giving.
By Amanda Moon Adams
Communications Lead for the Office of the Chief Science Data Officer
- Open Science
- Artificial Intelligence (AI)
- Landsat
- Lunar Reconnaissance Orbiter (LRO)
- Voyager 2
- Voyager Program
Article
1 month ago 3 min read 2023 Entrepreneurs Challenge Winner Skyline Nav AI: Revolutionizing GPS-Independent Navigation with Computer Vision
Article
3 months ago 4 min read NASA Open Science Reveals Sounds of Space
Article
3 months ago Keep Exploring Discover More Topics From NASA Open Science at NASA
Parker Solar Probe
Artificial Intelligence for Science
James Webb Space Telescope
Quantum eavesdropping could work even from inside a black hole
Hubble Spots a Chance Alignment
- Hubble Home
- Overview
- Impact & Benefits
- Science
- Observatory
- Team
- News
- Multimedia
- More
2 min read
Hubble Spots a Chance Alignment This NASA/ESA Hubble image features the spiral galaxy NGC 5530. ESA/Hubble & NASA, D. Thilker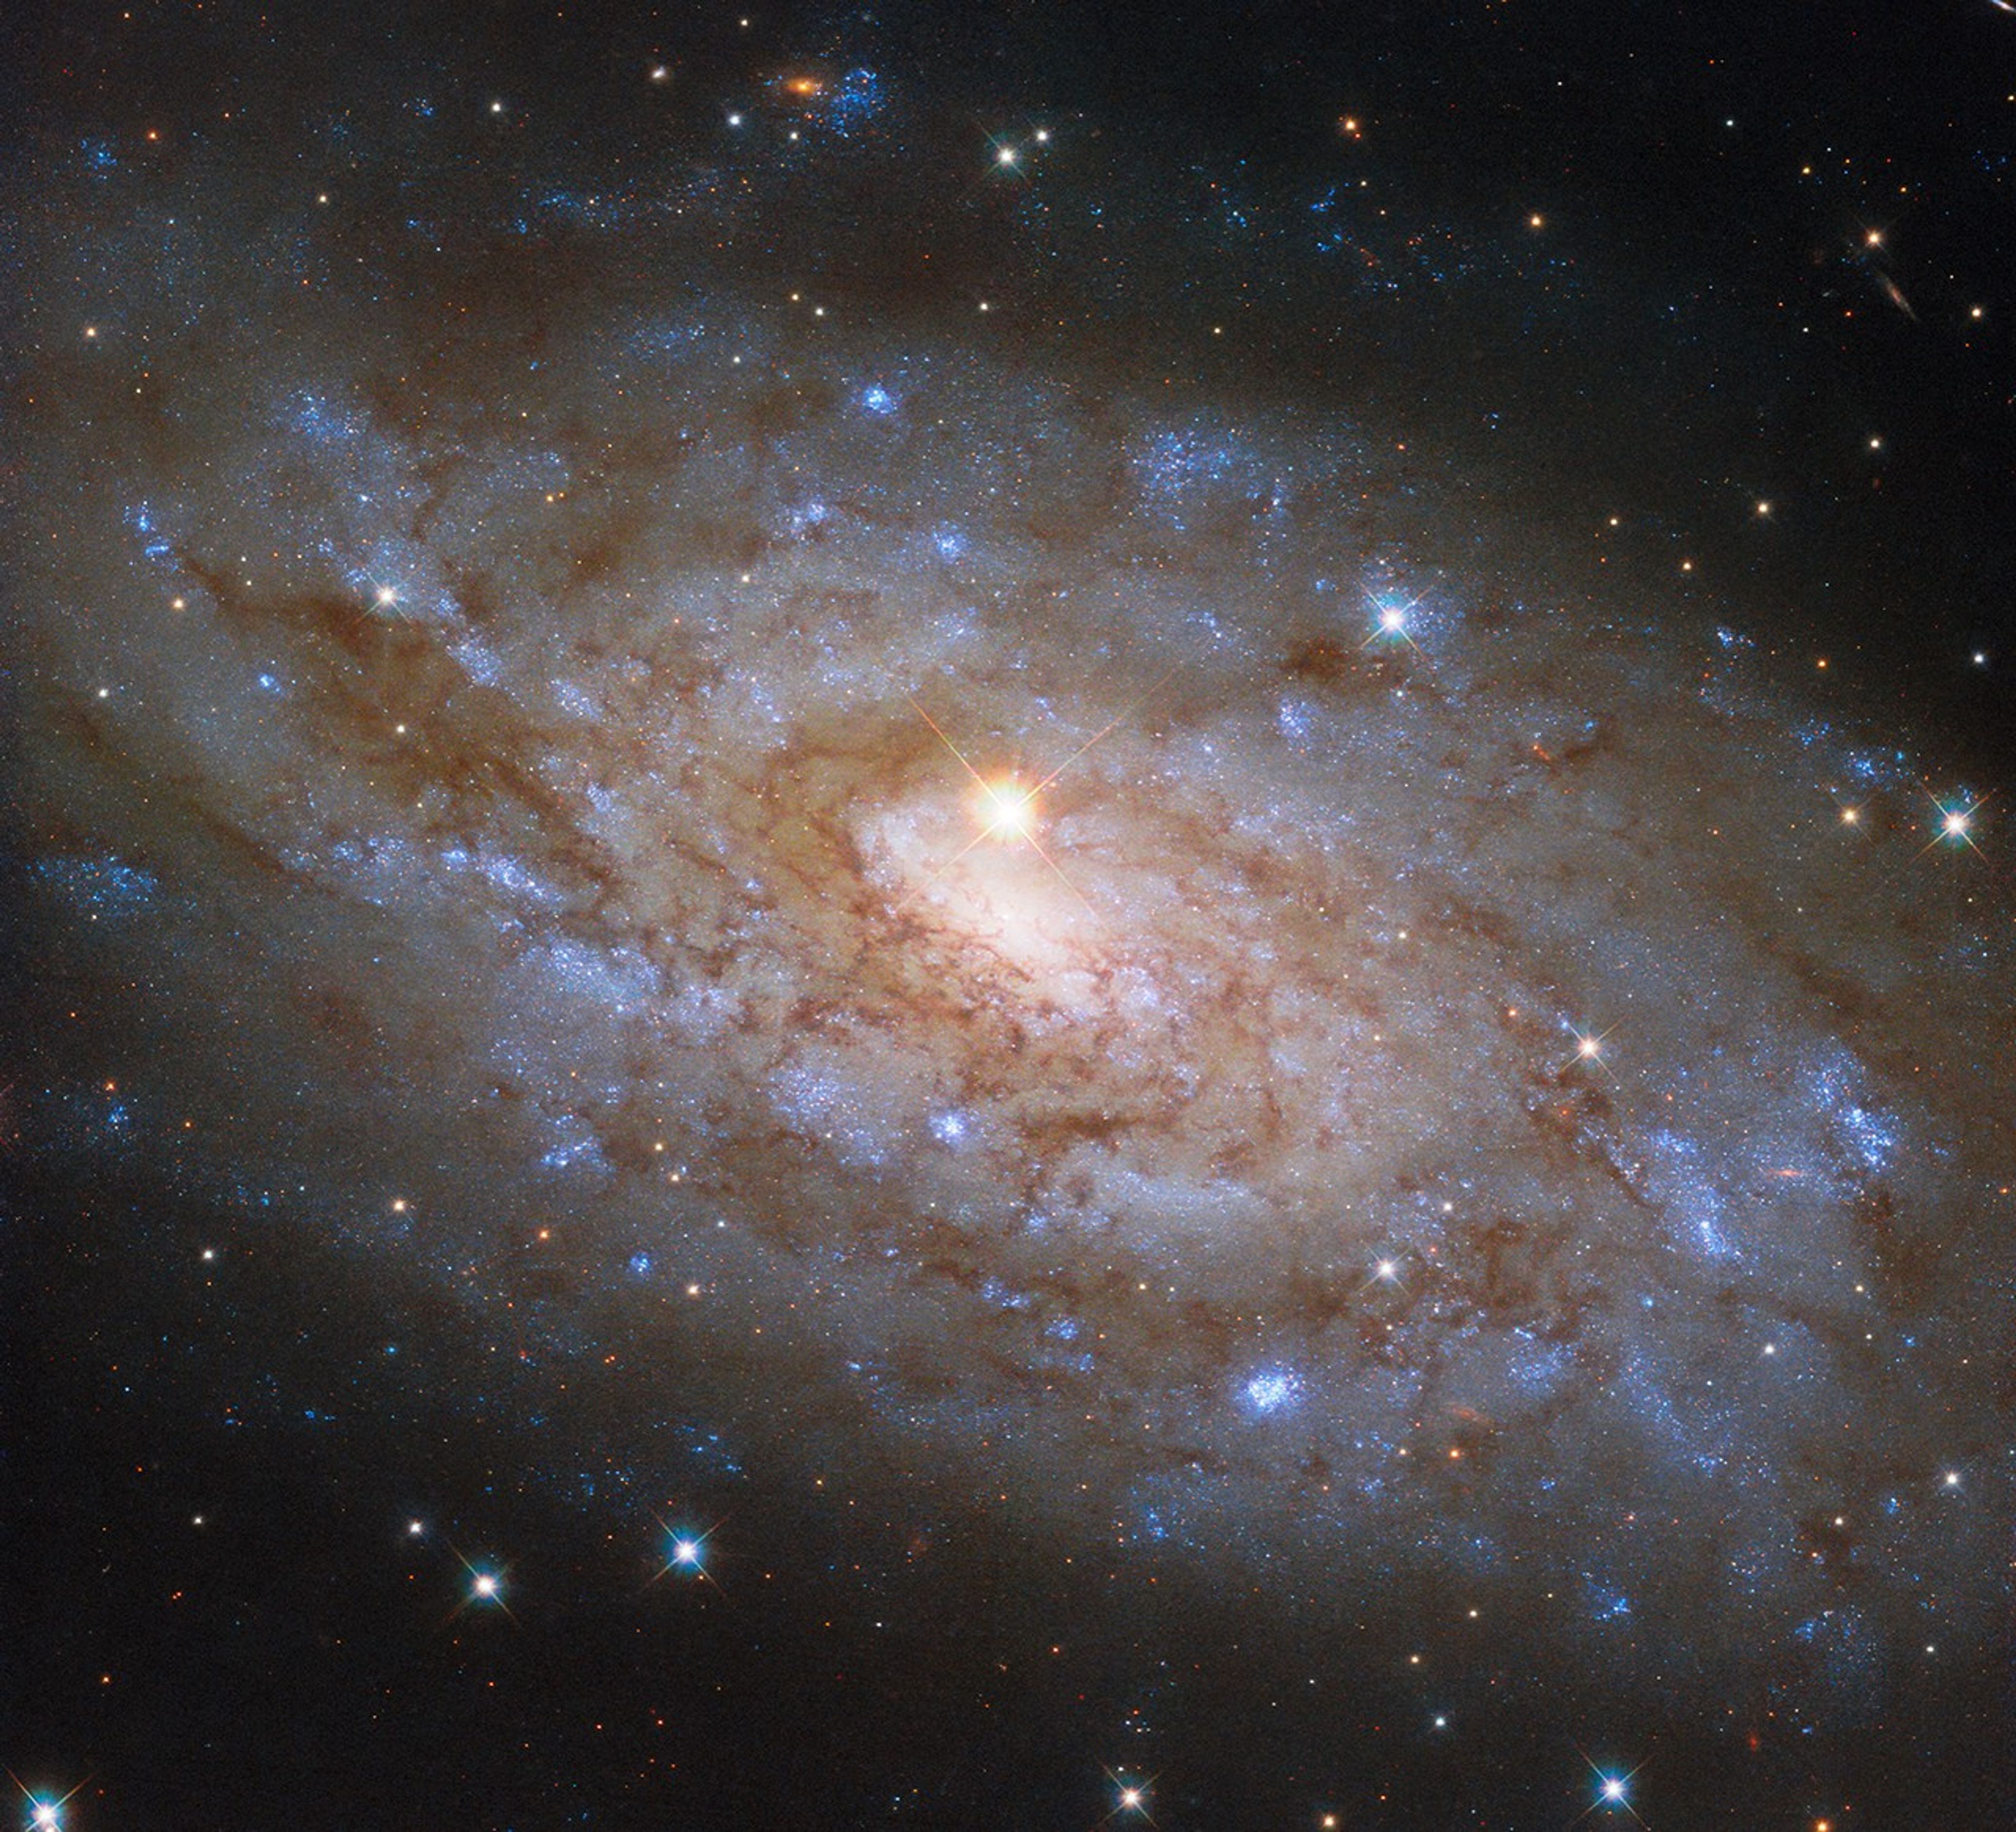
The subject of today’s NASA/ESA Hubble Space Telescope image is the stunning spiral galaxy NGC 5530. This galaxy is situated 40 million light-years away in the constellation Lupus, the Wolf, and classified as a ‘flocculent’ spiral, meaning its spiral arms are patchy and indistinct.
While some galaxies have extraordinarily bright centers that host a feasting supermassive black hole, the bright source near the center of NGC 5530 is not an active black hole but a star within our own galaxy, only 10,000 light-years from Earth. This chance alignment gives the appearance that the star is at the dense heart of NGC 5530.
If you pointed a backyard telescope at NGC 5530 on the evening of September 13, 2007, you would have seen another bright point of light adorning the galaxy. That night, Australian amateur astronomer Robert Evans discovered a supernova, named SN 2007IT, by comparing NGC 5530’s appearance through the telescope to a reference photo of the galaxy. While it’s remarkable to discover even one supernova using this painstaking method, Evans has in fact discovered more than 40 supernovae this way! This particular discovery was truly serendipitous: it’s likely that the light from the supernova completed its 40-million-year journey to Earth just days before Evans spotted the explosion.
Facebook logo @NASAHubble @NASAHubble Instagram logo @NASAHubble Share Details Last Updated Mar 28, 2025 Editor Andrea Gianopoulos Location NASA Goddard Space Flight Center Related Terms- Hubble Space Telescope
- Astrophysics
- Astrophysics Division
- Galaxies
- Goddard Space Flight Center
- Spiral Galaxies
- The Universe
Asteroid 2024 YR4 could still hit the moon, JWST observations reveal
How to watch Saturday's partial solar eclipse
Finding Clues in Ruins of Ancient Dead Star With NASA’s Chandra
People often think about archaeology happening deep in jungles or inside ancient pyramids. However, a team of astronomers has shown that they can use stars and the remains they leave behind to conduct a special kind of archaeology in space.
Mining data from NASA’s Chandra X-ray Observatory, the team of astronomers studied the relics that one star left behind after it exploded. This “supernova archaeology” uncovered important clues about a star that self-destructed – probably more than a million years ago.
Today, the system called GRO J1655-40 contains a black hole with nearly seven times the mass of the Sun and a star with about half as much mass. However, this was not always the case.
Originally GRO J1655-40 had two shining stars. The more massive of the two stars, however, burned through all of its nuclear fuel and then exploded in what astronomers call a supernova. The debris from the destroyed star then rained onto the companion star in orbit around it, as shown in the artist’s concept.
This artist’s impression shows the effects of the collapse and supernova explosion of a massive star. A black hole (right) was formed in the collapse and debris from the supernova explosion is raining down onto a companion star (left), polluting its atmosphere.CXC/SAO/M. Weiss
With its outer layers expelled, including some striking its neighbor, the rest of the exploded star collapsed onto itself and formed the black hole that exists today. The separation between the black hole and its companion would have shrunk over time because of energy being lost from the system, mainly through the production of gravitational waves. When the separation became small enough, the black hole, with its strong gravitational pull, began pulling matter from its companion, wrenching back some of the material its exploded parent star originally deposited.
While most of this material sank into the black hole, a small amount of it fell into a disk that orbits around the black hole. Through the effects of powerful magnetic fields and friction in the disk, material is being sent out into interstellar space in the form of powerful winds.
This is where the X-ray archaeological hunt enters the story. Astronomers used Chandra to observe the GRO J1655-40 system in 2005 when it was particularly bright in X-rays. Chandra detected signatures of individual elements found in the black hole’s winds by getting detailed spectra – giving X-ray brightness at different wavelengths – embedded in the X-ray light. Some of these elements are highlighted in the spectrum shown in the inset.
The team of astronomers digging through the Chandra data were able to reconstruct key physical characteristics of the star that exploded from the clues imprinted in the X-ray light by comparing the spectra with computer models of stars that explode as supernovae. They discovered that, based on the amounts of 18 different elements in the wind, the long-gone star destroyed in the supernova was about 25 times the mass of the Sun, and was much richer in elements heavier than helium in comparison with the Sun.
This analysis paves the way for more supernova archaeology studies using other outbursts of double star systems.
A paper describing these results titled “Supernova Archaeology with X-Ray Binary Winds: The Case of GRO J1655−40” was published in The Astrophysical Journal in May 2024. The authors of this study are Noa Keshet (Technion — Israel Institute of Technology), Ehud Behar (Technion), and Timothy Kallman (NASA’s Goddard Space Flight Center).
NASA’s Marshall Space Flight Center in Huntsville, Alabama, manages the Chandra program. The Smithsonian Astrophysical Observatory’s Chandra X-ray Center controls science operations from Cambridge, Massachusetts, and flight operations from Burlington, Massachusetts.
Read more from NASA’s Chandra X-ray Observatory.
Learn more about the Chandra X-ray Observatory and its mission here:
Visual Description
This release features an artist’s rendering of a supernova explosion, inset with a spectrum graph.
The artist’s illustration features a star and a black hole in a system called GRO J1655-40. Here, the black hole is represented by a black sphere to our upper right of center. The star is represented by a bright yellow sphere to our lower left of center. In this illustration, the artist captures the immensely powerful supernova as a black hole is created from the collapse of a massive star, with an intense burst of blurred beams radiating from the black sphere. The blurred beams of red, orange, and yellow light show debris from the supernova streaking across the entire image in rippling waves. These beams rain debris on the bright yellow star.
When astronomers used the Chandra X-ray Observatory to observe the system in 2005, they detected signatures of individual elements embedded in the X-ray light. Some of those elements are highlighted in the spectrum graph shown in the inset, positioned at our upper lefthand corner.
The graph’s vertical axis, on our left, indicates X-ray brightness from 0.0 up to 0.7 in intensity units. The horizontal axis, at the bottom of the graph, indicates Wavelength from 6 to 12 in units of Angstroms. On the graph, a tight zigzagging line begins near the top of the vertical axis, and slopes down toward the far end of the horizontal axis. The sharp dips show wavelengths where the light has been absorbed by different elements, decreasing the X-ray brightness. Some of the elements causing these dips have been labeled, including Silicon, Magnesium, Iron, Nickel, Neon, and Cobalt.
News Media ContactMegan Watzke
Chandra X-ray Center
Cambridge, Mass.
617-496-7998
mwatzke@cfa.harvard.edu
Lane Figueroa
Marshall Space Flight Center, Huntsville, Alabama
256-544-0034
lane.e.figueroa@nasa.gov
We've spotted auroras on Neptune for the first time
Little red dots seen by JWST might be a kind of black hole 'star'
Mars rover detects long-chain carbon molecules
Farewell, Gaia: spacecraft operations come to an end
On 27 March 2025, Gaia’s control team at ESA’s European Space Operations Centre switched off the spacecraft’s subsystems and sent it into a ‘retirement orbit’ around the Sun.
Though the spacecraft’s operations are now over, the scientific exploitation of Gaia’s data has just begun.
Launched in 2013, Gaia has transformed our understanding of the cosmos by mapping the positions, distances, motions, and properties of nearly two billion stars and other celestial objects. It has provided the largest, most precise multi-dimensional map of our galaxy ever created, revealing its structure and evolution in unprecedented detail.
The mission uncovered evidence of past galactic mergers, identified new star clusters, contributed to the discovery of exoplanets and black holes, mapped millions of quasars and galaxies, and tracked hundreds of thousands of asteroids and comets. The mission has also enabled the creation of the best visualisation of how our galaxy might look to an outside observer.
“The data from the Gaia satellite has and is transforming our understanding of the Milky Way, how it formed, how it has evolved and how it will evolve,” said Dr Nicholas Walton from Cambridge’s Institute of Astronomy, lead of the Gaia UK project team. “Gaia has been in continuous operation for over 10 years, faultless, without interruption, reflecting the quality of the engineering, with significant elements of Gaia designed and built in the UK. But now it is time for its retirement. Gaia has finished its observations of the night sky. But the analysis of the Gaia mission data continues. Later in 2026 sees the next Gaia Data Release 4, to further underpin new discovery unravelling the beauty and mystery of the cosmos.”
Gaia far exceeded its planned lifetime of five years, and its fuel reserves are dwindling. The Gaia team considered how best to dispose of the spacecraft in line with ESA’s efforts to responsibly dispose of its missions.
They wanted to find a way to prevent Gaia from drifting back towards its former home near the scientifically valuable second Lagrange point (L2) of the Sun-Earth system and minimise any potential interference with other missions in the region.
“Switching off a spacecraft at the end of its mission sounds like a simple enough job,” said Gaia Spacecraft Operator Tiago Nogueira. “But spacecraft really don’t want to be switched off.
“We had to design a decommissioning strategy that involved systematically picking apart and disabling the layers of redundancy that have safeguarded Gaia for so long, because we don’t want it to reactivate in the future and begin transmitting again if its solar panels find sunlight.”
On 27 March, the Gaia control team ran through this series of passivation activities. One final use of Gaia’s thrusters moved the spacecraft away from L2 and into a stable retirement orbit around the Sun that will minimise the chance that it comes within 10 million kilometres of Earth for at least the next century.
The team then deactivated and switched off the spacecraft’s instruments and subsystems one by one, before deliberately corrupting its onboard software. The communication subsystem and the central computer were the last to be deactivated.
Gaia’s final transmission to ESOC mission control marked the conclusion of an intentional and carefully orchestrated farewell to a spacecraft that has tirelessly mapped the sky for over a decade.
Though Gaia itself has now gone silent, its contributions to astronomy will continue to shape research for decades. Its vast and expanding data archive remains a treasure trove for scientists, refining knowledge of galactic archaeology, stellar evolution, exoplanets and much more.
“No other mission has had such an impact over such a broad range of astrophysics. It continues to be the source of over 2,000 peer-reviewed papers per year, more than any other space mission,” said Gaia UK team member Dr Dafydd Wyn Evans, also from the Institute of Astronomy. “It is sad that its observing days are over, but work is continuing in Cambridge, and across Europe, to process and calibrate the final data so that Gaia will still be making its impact felt for many years in the future.”
A workhorse of galactic exploration, Gaia has charted the maps that future explorers will rely on to make new discoveries. The star trackers on ESA’s Euclid spacecraft use Gaia data to precisely orient the spacecraft. ESA’s upcoming Plato mission will explore exoplanets around stars characterised by Gaia and may follow up on new exoplanetary systems discovered by Gaia.
The Gaia control team also used the spacecraft’s final weeks to run through a series of technology tests. The team tested Gaia’s micro propulsion system under different challenging conditions to examine how it had aged over more than ten years in the harsh environment of space. The results may benefit the development of future ESA missions relying on similar propulsion systems, such as the LISA mission.
The Gaia spacecraft holds a deep emotional significance for those who worked on it. As part of its decommissioning, the names of around 1500 team members who contributed to its mission were used to overwrite some of the back-up software stored in Gaia’s onboard memory.
Personal farewell messages were also written into the spacecraft’s memory, ensuring that Gaia will forever carry a piece of its team with it as it drifts through space.
As Gaia Mission Manager Uwe Lammers put it: “We will never forget Gaia, and Gaia will never forget us.”
The Cambridge Gaia DPAC team is responsible for the analysis and generation of the Gaia photometric and spectro-photometric data products, and it also generated the Gaia photometric science alert stream for the duration of the satellite's in-flight operations.
Adapted from a media release by the European Space Agency.
The European Space Agency’s Gaia spacecraft has been powered down, after more than a decade spent gathering data that are now being used to unravel the secrets of our home galaxy.
ESA/Gaia/DPAC, Stefan Payne-WardenaarArtist's impression of the Milky Way
The text in this work is licensed under a Creative Commons Attribution-NonCommercial-ShareAlike 4.0 International License. Images, including our videos, are Copyright ©University of Cambridge and licensors/contributors as identified. All rights reserved. We make our image and video content available in a number of ways – on our main website under its Terms and conditions, and on a range of channels including social media that permit your use and sharing of our content under their respective Terms.
BBC Inside Science
Witnessing the onset of reionization through Lyman-α emission at redshift 13
Nature, Published online: 26 March 2025; doi:10.1038/s41586-025-08779-5
Spectroscopy from the JWST Advanced Deep Extragalactic Survey of a galaxy at redshift 13 shows a singular, bright emission line identified as Lyman-α, suggesting the onset of reionization only 330 Myr after the Big Bang.A lighthouse galaxy shines unexpectedly through the fog of the cosmic dawn
Nature, Published online: 26 March 2025; doi:10.1038/d41586-025-00899-2
Ultraviolet light from a galaxy observed when the Universe was just 330 million years old has intriguing implications for understanding how the first generations of stars and black holes were formed.