Please note that this machine has now been decommissioned.
This page remains for historical information only.
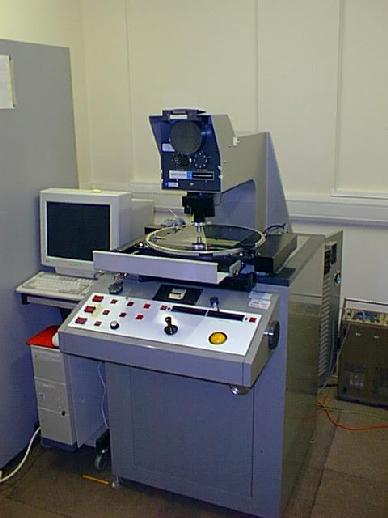
The PDS (Fig. 1) is a computer controlled measuring machine primarily used for retrieving data from astronomical photographic plates. It measures both plate position and photographic density. It is currently housed in the old RGO building.
The plates to be measured are mounted on a clear glass platen whose position can be controlled to 1 micron in each axis. Plates up to 9 x 9 inches can be measured. The size of the light spot can be matched to the finest detail on the plate to be measured by a series of apertures and microscope objectives.
Measurements of plate density are made in transmission i.e. a thin beam of light is shone through the plate and measured by a photomultiplier tube. A range of 10D in photographic density is measurable.
The accuracy with which the position of the PDS table can be measured lends itself to applications in stellar astrometry or the accurate measurement of star positions.
A recent satellite mission (ROSAT) involved surveying the sky for bright X-ray sources. Many thousands were found but the positions were rather poorly defined. The immediate areas around these sources were therefore scanned on the PDS in try and correlate the optical images on the photographic plate with the new X-ray sources. Such optical positions were important for directing large ground-based telescopes for follow-up observations.
Fig. 2 shows a portion of a ROSAT field measured on the PDS. The plate was taken with the ESO Schmidt telescope in Chile.
Other astrometric projects have involved the measurement of the accurate positions of radio stars in order to help link the radio and optical reference frames, positions of background star along the tracks of the outer planets in order to determine the orbits of the major satellites and the measurement of positions to an accuracy of 1 arc second of 526 faint Landolt equatorial photometric standards to facilitate routine calibrations at the telescope and oncrease observing efficiency.
Other projects have been carried out in recent months. Spectra of eclipsing binary stars show significant differences depending on the relative positions of the stars with respect to us. One star can act as a probe of the atmosphere of the other as it passes in front. The PDS measures the positions and intensity of the spectral lines allowing calculations to be made about the constitution, temperature and density of stellar atmospheres. Such a system is 31 Cygni in which a large cool star and a smaller hotter companion orbit each other in a period of 900 days.
The diagram above shows an intensity trace from the PDS of part of the spectrum of 31 Cygni. The large, cool star is in front of its hotter, smaller companion. (Fig. 3)

Later in the orbital period as the hot star moves out of eclipse, spectral lines from it can be seen appearing in addition to those from its giant companion. (Fig. 4)
A large number of electronographic spectra of active galaxies have been scanned in collaboration with the Kazakh Institute of Sciences and more work is planned in this direction.
There is no formal procedure for obtaining time on the PDS. In order to reduce the need for extensive user facilities and the likelihood of user frustration and/or system damage the PDS is run as a one-man operation, delivering scanning products or lists of coordinates to the user.
Dr M. T. Bridgeland, (Technical)
Institute of Astronomy,
Madingley Road,
Cambridge,
CB3 0HA,
U. K.
Mr R. W. Argyle, (Astronomical)
Institute of Astronomy,
Madingley Road,
Cambridge,
CB3 0HA,
U. K.
Last update 2005 March 14